
- How to Calculate Performance Across Multiple Crypto Assets
- Why Multi-Asset Performance Differs From Single Trade Results
- Understanding Combined Performance in Multi-Asset Investing
- Why Reported Performance Does Not Reflect Real Investment Efficiency
- How Structure Changes the Meaning of Investment Performance
- Why ROI Across Multiple Assets Differs From Trade-Level Results
- How Allocation Affects Perceived Performance Efficiency
- Allocation Impact on Portfolio Efficiency
- Why Unrealized Gains Distort Performance Perception
- How Timing Affects Portfolio Performance Interpretation
- Why Portfolio Performance Requires Context, Not Just Calculation
- How a Structured Tool Helps Reveal Hidden Patterns
- How Capital Distribution Defines Risk and Long-Term Outcomes
- Why Risk Builds Faster Than Expected in Multi-Asset Portfolios
- How Correlation Between Assets Affects Portfolio Stability
- Correlation Impact on Portfolio Behavior
- How Allocation Balances Growth and Risk in Multi-Asset Investing
- From Performance Tracking to a Consistent Decision Framework
- Why Investors Struggle With Consistent Investment Results
- How Structured Analysis Improves Investment Decisions
- Final Conclusion: Performance Is a System, Not a Snapshot
How to Calculate Performance Across Multiple Crypto Assets
Most investors misunderstand their results when multiple assets are involved, especially when it comes to how crypto portfolio calculation actually works in real scenarios. However, this perception often breaks down once a portfolio includes multiple coins. When you hold several assets with different entry prices and allocation sizes, returns no longer act as a simple number—they turn into a structured outcome shaped by multiple variables.
At first, calculating gains feels straightforward. You buy an asset, the price increases, and you measure the difference. This logic works at the trade level. However, once you move to a combined view of multiple positions, the calculation changes. Each asset contributes differently, and the final result depends on how these contributions interact.
Because of this, performance analysis goes beyond simply adding gains and losses together. Instead, you need to understand how capital is distributed and how each position influences the overall outcome.
👉 Insight:
In multi-asset setups, investors do not simply calculate results—they shape them through allocation and position sizing.
Why Multi-Asset Performance Differs From Single Trade Results
Tracking gains for a single position feels straightforward, especially when you focus on one entry and one outcome. However, a group of positions behaves differently because it combines multiple trades with different timing, sizes, and results.
Understanding crypto portfolio profit and loss becomes more complex as allocation and timing vary across assets.
To see how this works in practice, let’s look at a simple multi-asset example.
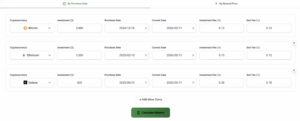
A realistic crypto portfolio calculation example showing how different allocation sizes, entry timing, and fee structures affect multi-asset performance.
Example of entering Bitcoin, Ethereum, and Solana positions into a crypto portfolio calculator to simulate allocation, entry timing, and fee structures across multiple assets.
For example, you may have one asset generating strong gains while another produces moderate losses. At first glance, the gain may seem dominant. However, if the weaker position holds a larger share of capital, it can offset the entire outcome.
Because of this, you cannot evaluate results using the same logic as individual trades. Instead, you need a weighted approach that considers how capital is distributed.
Additionally, investors often enter positions at different times. This creates multiple cost bases within the same structure. If you do not align these variables, your calculations become estimates rather than precise results.
Understanding Combined Performance in Multi-Asset Investing
The combined outcome reflects the result of all positions within your holdings, a concept widely used in financial portfolio analysis frameworks such as Investopedia.
At a deeper level, portfolio PnL combines:
- total invested capital across assets
- current combined market value
- allocation-weighted contribution of each asset
Many errors in crypto portfolio profit and loss calculation come from ignoring how capital is distributed.
You need to evaluate these components together to understand real performance. Looking at them separately leads to incomplete conclusions.
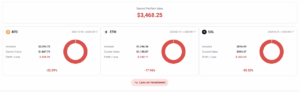
A realistic crypto portfolio calculation result showing how allocation size, entry timing, and market movement influence overall profit and loss across multiple assets.
Example of portfolio performance results showing how different assets contribute to the total outcome based on allocation and market movement.
Looking at them separately leads to incomplete conclusions.
For instance, an asset showing a high percentage gain may contribute very little to the overall portfolio if its allocation is small. At the same time, a moderate movement in a larger position can define the final outcome.
👉 Insight:
Balance defines overall results—not just the best-performing position.
Why Reported Performance Does Not Reflect Real Investment Efficiency
After calculating total gains, many investors assume they understand how well their investments perform. However, this assumption can be misleading. The final result shows the outcome, but it does not fully explain how efficiently capital is being used.
At the portfolio level, multiple variables shape performance at the same time. Each asset has its own entry point, allocation size, and reaction to market conditions. Because of this, the final result often hides important details about how that performance actually formed.
For example, a portfolio may show a positive result overall. However, one strong position may drive that result while the rest of the assets underperform. In this situation, the portfolio looks healthy, but its structure lacks stability.
👉 Insight:
A profitable portfolio is not always an efficient portfolio.
How Structure Changes the Meaning of Investment Performance
In single trades, performance remains simple. You evaluate one entry and one outcome. However, in a multi-asset portfolio, performance turns into a combined result.
Each asset affects the portfolio differently based on its allocation. This means performance does not depend on individual gains alone—it depends on how those gains interact with capital distribution.
This is where crypto portfolio calculation becomes essential to understand how each position contributes to the overall outcome.
For instance, a high return in a small position often has little impact. Meanwhile, a moderate return in a large position can shape the overall result. Because of this, you should always interpret performance in relation to allocation.
Timing adds another layer of complexity. Assets purchased at different times respond differently to the same market movement. As a result, performance becomes uneven across positions.
Why ROI Across Multiple Assets Differs From Trade-Level Results
At the trade level, performance looks clear and direct. However, at the portfolio level, that clarity disappears. Performance gets averaged across multiple positions, which changes how results appear.
As a result, crypto portfolio calculation requires a more structured approach to interpret these averaged outcomes correctly.
Strong gains in one asset often get diluted by weaker performance in others. At the same time, small losing positions may stay hidden because they carry less weight.
Because of this, portfolio-level ROI often looks smoother and less volatile than individual trade results. While this creates a sense of stability, it can also hide inefficiencies.
👉 Insight:
Portfolio-level performance reduces noise, but it can also hide imbalance.
How Allocation Affects Perceived Performance Efficiency
Allocation plays a central role in how investors interpret performance, especially when applying a structured crypto portfolio allocation strategy to balance risk and returns.
Allocation Impact on Portfolio Efficiency
| Scenario | Allocation Pattern | Observed Outcome | Keywords |
|---|---|---|---|
| Concentrated | High weight in one asset | Strong but unstable performance | crypto allocation |
| Balanced | Even distribution | Stable but moderate performance | portfolio balance crypto |
| Fragmented | Many small positions | Inconsistent results | multi asset portfolio |
Source: Allocation impact derived from portfolio construction models used in financial analysis frameworks (e.g., Investopedia).
As shown above, allocation defines how performance behaves. A concentrated portfolio can generate strong returns, but it also increases risk. In contrast, a balanced portfolio may produce more stable outcomes with lower volatility.
Accurate crypto portfolio calculation depends on understanding how allocation influences these performance patterns.
For this reason, you should always evaluate performance alongside allocation.
Why Unrealized Gains Distort Performance Perception
Unrealized profit often distorts how investors perceive performance. Because it depends on current market prices, it changes quickly with volatility.
For example, during strong market movements, portfolios may show significant gains. However, if investors do not realize those gains, they remain exposed to reversals. As a result, many overestimate their performance.
High-volatility assets make this problem worse. They create temporary spikes in portfolio value that look meaningful but rarely represent sustainable growth.
Without proper crypto portfolio calculation, these temporary gains can easily lead to misleading conclusions.
👉 Insight:
Unrealized gains reflect current conditions—not confirmed outcomes.
How Timing Affects Portfolio Performance Interpretation
Time plays a subtle but critical role in portfolio analysis. Assets bought at different moments react differently to the same market conditions.
For example, early entries may show strong gains, while later entries may still sit near break-even. When you combine these positions, they create a mixed performance profile.
Because of this, evaluating performance at a single point in time can mislead investors. Instead, you should analyze performance over a period to understand consistency.
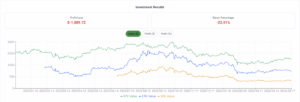
A realistic crypto portfolio trend analysis showing how different entry timing, allocation strategies, and market cycles influence performance across multiple assets over time.
Example of portfolio value trends over time showing how Bitcoin, Ethereum, and Solana evolve differently based on entry timing and market conditions.
Instead, you should analyze performance over a period to understand consistency.
Why Portfolio Performance Requires Context, Not Just Calculation
Even when calculations are accurate, they do not always tell the full story. Without context, performance metrics can lead to incorrect conclusions.
A positive portfolio result may hide structural weaknesses, such as overexposure to a single asset. At the same time, flat performance may actually reflect a well-balanced strategy in volatile conditions.
Because of this, you should always interpret performance within the broader context of allocation, structure, and timing.
👉 Insight:
Numbers alone do not explain performance—context gives them meaning.
How a Structured Tool Helps Reveal Hidden Patterns
A structured analysis tool moves evaluation beyond surface-level results.
Instead of focusing only on outcomes, it helps you understand how those results actually form, especially when using a crypto portfolio tracker and calculator to monitor performance across multiple assets.
By organizing data in a consistent way, it becomes easier to identify patterns such as:
- which positions drive overall results
- how capital distribution shapes outcomes
- where inefficiencies exist
Over time, this structured approach leads to clearer insights and more stable decisions.
How Capital Distribution Defines Risk and Long-Term Outcomes
After understanding how results behave across multiple positions, the next step is controlling how those results evolve over time. This is where capital distribution becomes critical. While tracking and calculation provide visibility, distribution determines direction.
At a basic level, allocation defines how much capital you assign to each asset. However, its impact goes far beyond distribution. It shapes how the entire portfolio reacts to market conditions. For example, a portfolio heavily weighted toward one asset reacts more aggressively to price changes. In contrast, a balanced allocation produces smoother performance.
Because of this, allocation is not just a structural choice—it acts as a strategic decision. It determines whether your portfolio behaves like a high-risk position or a controlled system.
👉 Insight:
In most portfolios, allocation creates risk—not the assets themselves.
Why Risk Builds Faster Than Expected in Multi-Asset Portfolios
Many investors underestimate how quickly risk accumulates. When you hold multiple positions at the same time, exposure compounds instead of increasing in a simple, linear way.
For instance, holding several assets that move in the same direction increases overall sensitivity. Even if each position looks manageable on its own, their combined effect can create significant volatility.
In addition, adding new positions without adjusting existing ones increases total exposure. Over time, portfolios often become riskier without the investor noticing it.
This is why you should monitor exposure alongside performance.
👉 Insight:
Total exposure defines portfolio risk—not individual positions.
How Correlation Between Assets Affects Portfolio Stability
In crypto markets, many assets move together, especially during strong trends, a behavior commonly explained in correlation analysis within financial markets.
For example, Bitcoin and Ethereum often move in the same direction. At the same time, many altcoins amplify broader market movements. As a result, adding more assets does not always reduce risk—it can increase it.
Correlation Impact on Portfolio Behavior
| Correlation Type | Portfolio Behavior | Keywords |
|---|---|---|
| High Correlation | Strong gains and losses across all assets | crypto correlation |
| Moderate Correlation | Partial diversification | portfolio diversification crypto |
| Low Correlation | More stable and balanced performance | multi asset portfolio |
Source: Correlation behavior based on multi-asset investment theory and observed market dynamics (e.g., Investopedia).
As shown above, correlation plays a key role in shaping portfolio outcomes. For this reason, you should evaluate diversification based on behavior—not just the number of assets.
👉 Insight:
A portfolio becomes diversified when assets behave differently—not when you hold more of them.
How Allocation Balances Growth and Risk in Multi-Asset Investing
Effective portfolio management requires balancing two forces: growth and stability. Increasing allocation to volatile assets can improve returns, but it also raises risk.
A structured approach adjusts allocation based on clear objectives. For example, an aggressive portfolio prioritizes growth, while a conservative one focuses on stability.
However, consistency matters most. Random allocation changes often lead to unstable results. Instead, you should follow a repeatable framework that aligns with your risk tolerance.
You should also review allocation periodically rather than reacting to every short-term movement. This helps avoid emotional decisions.
From Performance Tracking to a Consistent Decision Framework
Tracking and calculating portfolio performance only matter if they lead to better decisions. Without structure, even accurate data leads to inconsistent actions.
A practical decision framework includes:
- tracking portfolio performance over time
- identifying which assets drive results
- evaluating exposure and correlation
- adjusting allocation when needed
Consistency in applying these steps matters more than perfection in each calculation.
👉 Insight:
Consistency in decisions drives long-term results—not isolated accuracy.
Why Investors Struggle With Consistent Investment Results
Even with access to tools and data, many investors struggle to stay consistent. The issue is rarely technical—it comes from behavior.
Common patterns include reacting to short-term price movements, overestimating strong positions, and ignoring the overall portfolio structure. These behaviors create instability, even when the strategy is solid.
Without structured tracking, investors also struggle to identify what actually works. As a result, they change strategies too frequently.
How Structured Analysis Improves Investment Decisions
A structured calculation tool turns raw data into actionable insight. Instead of relying on rough estimates, it helps you evaluate overall results, capital distribution, and exposure within a consistent framework.
By applying the same structure over time, you gain a clearer understanding of how your investments behave under different conditions. This leads to more stable decisions and stronger long-term outcomes.
Final Conclusion: Performance Is a System, Not a Snapshot
Investment results cannot be reduced to a single number or a single moment. Multiple factors interact to shape the final outcome, including capital distribution, market behavior, and timing.
Understanding results requires more than simple observation. It depends on structured tracking, consistent evaluation, and disciplined decision-making.
Investors who treat their investments as a system—rather than a collection of isolated trades—achieve more stable and repeatable outcomes.
👉 Final Insight:
Long-term success comes from understanding how your overall strategy behaves—not just what individual positions generate.