RSI in Crypto: Momentum Regimes, Divergence & Risk Signals
How Momentum Regimes, Divergence, and Structure Define RSI’s Real Value
- Why RSI Still Matters in Crypto — But Only If Used Correctly
- What RSI Actually Measures (And Why That Matters)
- Key RSI Properties
- Momentum Regimes: The Missing Concept in Most RSI Guides
- Typical RSI Regimes in Crypto
- Divergence: RSI’s Most Misunderstood Signal
- What Divergence Actually Signals
- What RSI Is Commonly Used For (Professional Context)
- What RSI Is Not Designed to Do
- Why RSI Works Best With Structure, Not Against It
- Indicator Categories Context (Why RSI Needs Help)
- Core Crypto Indicators Explained
- How Professionals Actually Use Them in 2025
- Relative Strength Index (RSI): Momentum Context, Not Timing
- What RSI Is Commonly Used For (Professional Context)
- What RSI Is Not Designed to Do
- Moving Averages (SMA & EMA): Defining Market Structure
- How Professionals Use Moving Averages
- MACD: Momentum Shifts Within Trends
- Bollinger Bands: Volatility Awareness, Not Direction
- Professional Applications
- Average True Range (ATR): Risk Measurement, Not Signal Generation
- Core Indicators and Their Primary Function
- Why No Single Indicator Works Alone
- How Indicators Support Portfolio-Level Decisions
- How Professionals Combine Indicators Safely (Frameworks, Timeframes & Portfolio Context in 2025)
- The Core Principle: Indicators Confirm, They Do Not Decide
- Indicator Confluence: Fewer Tools, Clearer Signals
- Timeframe Alignment: The Most Ignored Skill in Indicator Use
- Trending vs Ranging Markets: Indicators Behave Differently
- When Indicators Fail (And Why That’s Normal)
- Portfolio-Level Indicator Use: The 2025 Shift
- Indicator Role by Decision Layer
- Why Simplicity Beats Complexity
- Behavioral Discipline: The Hidden Variable
- Beginner Misuse vs Professional Interpretation
- Final Takeaway: Indicators Are Tools, Not Answers
Why RSI Still Matters in Crypto — But Only If Used Correctly
In 2025, crypto markets are no longer driven purely by retail speculation. Institutional participation, ETF flows, algorithmic execution, and cross-market correlations have reshaped how price behaves. Yet despite this structural evolution, one technical indicator continues to appear across almost every trading desk, analytics platform, and portfolio dashboard: the Relative Strength Index (RSI).
RSI remains relevant not because it predicts price, but because it measures momentum behavior — and momentum is one of the few market properties that persists across regimes. However, most RSI-related losses do not come from the indicator itself. They come from misinterpretation.
The biggest mistake investors make is treating RSI as a buy-or-sell signal generator. In reality, RSI is a contextual indicator, designed to help answer how price is moving, not where it should go.
In modern crypto analysis, RSI is most effective when used to:
-
Identify momentum regimes
-
Detect structural divergence
-
Support risk and exposure decisions
-
Compare relative strength across assets
Used incorrectly, RSI creates false confidence. Used correctly, it becomes a powerful risk-awareness tool.
Source: Investopedia – Relative Strength Index (RSI)
What RSI Actually Measures (And Why That Matters)
RSI measures the speed and persistence of recent price movements by comparing average gains to average losses over a defined period, most commonly 14 units. The output is normalized between 0 and 100.
Importantly, RSI does not measure:
-
Value
-
Fair price
-
Fundamentals
-
Future direction
Instead, it measures momentum pressure.
This distinction is critical in crypto markets, where price can remain irrational — or trend persistently — for far longer than traditional valuation models would suggest.
Key RSI Properties
-
High RSI = strong upward momentum, not “overpriced”
-
Low RSI = strong downward momentum, not “cheap”
-
Neutral RSI = balanced pressure, often seen during consolidation
Momentum does not reverse simply because it is strong. In trending crypto markets, RSI can remain elevated or suppressed for extended periods without producing meaningful reversals.
Momentum Regimes: The Missing Concept in Most RSI Guides
The most important evolution in RSI usage over the last few years is regime-based interpretation.
Rather than focusing on fixed levels like 70 and 30, professional analysts study how RSI behaves within different market regimes.
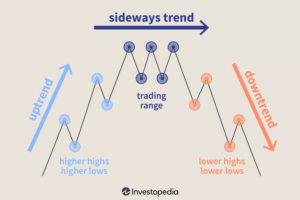
Typical RSI Regimes in Crypto
| Market Regime | Common RSI Behavior | Interpretation |
|---|---|---|
| Strong Bull Trend | RSI holds 40–80 | Momentum supports continuation |
| Strong Bear Trend | RSI holds 20–60 | Downside pressure dominates |
| Range-Bound Market | RSI oscillates 30–70 | Mean-reversion environment |
| Distribution Phase | Lower RSI highs | Momentum weakening |
| Accumulation Phase | Higher RSI lows | Selling pressure fading |
Source: CoinMarketCap historical price data, Forvest Research (2025)
This framework explains why “RSI overbought” signals fail so often in bull markets — and why “RSI oversold” signals fail in prolonged bear phases.
RSI is not broken. The interpretation is.
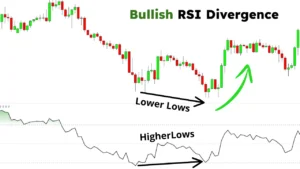
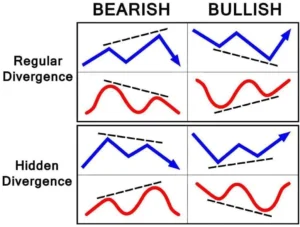
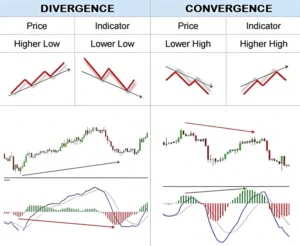
Divergence: RSI’s Most Misunderstood Signal
RSI divergence occurs when price and momentum move out of alignment. While divergence is often presented as a reversal signal, professionals treat it differently.
What Divergence Actually Signals
-
A change in momentum quality
-
Potential trend fatigue
-
Increased risk of consolidation or pullback
What it does not guarantee:
-
Immediate reversals
-
Trend termination
-
Profitable counter-trend trades
Divergence becomes meaningful only when combined with:
-
Market structure (higher highs / lower lows)
-
Volatility behavior
-
Volume confirmation
-
Higher-timeframe context
Without context, divergence is noise.
Source: Investopedia — RSI & divergence educational reference.
What RSI Is Commonly Used For (Professional Context)
RSI plays a supporting role in modern crypto analysis. Its strongest applications include:
-
Identifying momentum strength or weakness
-
Distinguishing trend continuation vs exhaustion
-
Comparing relative strength between assets
-
Evaluating risk during late-cycle moves
-
Supporting portfolio allocation decisions
RSI becomes especially valuable when applied across assets, not just on a single chart. Comparing RSI behavior between Bitcoin, Ethereum, and high-beta altcoins often reveals early rotation signals — long before price confirms them.
What RSI Is Not Designed to Do
To avoid misuse, it is equally important to define what RSI should never be used for:
-
Predict precise tops or bottoms
-
Define “cheap” or “expensive” prices
-
Replace trend or volatility analysis
-
Generate standalone trading signals
-
Override higher-timeframe structure
RSI is an input, not a decision engine.
💡Understanding RSI correctly is only one part of disciplined decision-making — managing exposure and downside risk requires a broader framework of crypto investment risk management.
Why RSI Works Best With Structure, Not Against It
In strong crypto trends, RSI naturally adapts to the dominant direction:
-
Bull markets push RSI higher
-
Bear markets suppress RSI lower
Fighting this behavior — for example, selling simply because RSI exceeds 70 — leads to systematic underperformance.
Professional interpretation focuses instead on:
-
RSI range behavior over time
-
Momentum shifts relative to structure
-
Alignment across multiple timeframes
RSI is most effective when it confirms structure — not when it attempts to contradict it.
Indicator Categories Context (Why RSI Needs Help)
RSI belongs to the momentum indicator category. Momentum alone cannot explain:
-
Volatility expansion
-
Liquidity shocks
-
Trend direction
-
Participation strength
This is why RSI is rarely used alone in professional frameworks. It is typically combined with:
-
Moving averages (trend)
-
Volatility measures (risk)
-
Volume indicators (participation)
We’ll explore these combinations in later sections of this guide.
💡To understand how RSI fits alongside trend, volatility, and volume indicators within a complete analytical framework, see our full breakdown in Best Crypto Technical Indicators for 2025: RSI, MACD, Moving Averages & More.
Core Crypto Indicators Explained
How Professionals Actually Use Them in 2025
By 2025, the way experienced crypto investors use technical indicators has changed significantly. Indicators are no longer treated as signal generators or shortcuts to prediction. Instead, they function as analytical lenses — tools that help interpret market behavior, manage exposure, and control risk under uncertainty.
This section explains how the most widely used crypto indicators actually work, what questions they are designed to answer, and where they are most commonly misunderstood. The focus is not on formulas or settings, but on professional interpretation.
Relative Strength Index (RSI): Momentum Context, Not Timing
The Relative Strength Index remains one of the most referenced momentum indicators in crypto markets. Its widespread use, however, has also made it one of the most misapplied tools.
At its core, RSI reflects momentum pressure. It compares average gains to average losses over a defined period — typically 14 units — and normalizes that relationship on a scale from 0 to 100. Importantly, this metric does not measure value, trend direction, or fair price.
Instead, RSI answers a narrower but critical question:
How persistent and aggressive is recent price movement?
Because of this, elevated or depressed readings do not imply imminent reversals. In strong trends, momentum can remain extreme for long periods without meaningful pullbacks.
Source: CoinMarketCap historical price data
What RSI Is Commonly Used For (Professional Context)
In institutional-style analysis, RSI is primarily used to:
-
Assess momentum strength or weakness
-
Identify momentum divergence relative to price structure
-
Distinguish bullish vs bearish momentum regimes
-
Compare relative strength across multiple assets
Over time, professionals have learned that RSI is most valuable when it supports risk awareness, not entry timing.
What RSI Is Not Designed to Do
Equally important is understanding what this indicator should never be used for:
-
Predicting exact tops or bottoms
-
Labeling price as “cheap” or “expensive”
-
Replacing trend or volatility analysis
-
Acting as a standalone trading signal
Key takeaway: RSI describes momentum behavior — it does not forecast outcomes.
Moving Averages (SMA & EMA): Defining Market Structure
While momentum indicators describe speed, moving averages describe structure. They smooth price data over time to clarify direction and filter noise.
There are two primary types used across crypto markets:
-
Simple Moving Average (SMA): Equal weight to all data points
-
Exponential Moving Average (EMA): Greater weight on recent prices
Both are inherently lagging — and that is a feature, not a flaw. Their purpose is confirmation, not anticipation.
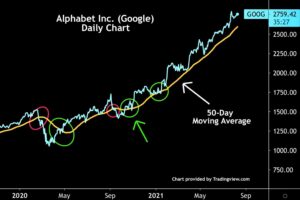
Source: TradingView (educational chart example)
How Professionals Use Moving Averages
In practice, moving averages are applied to:
-
Identify dominant trend direction
-
Define dynamic support and resistance zones
-
Filter participation in the direction of the trend
-
Measure trend persistence and slope
Rather than relying on a single line, analysts typically evaluate relationships:
-
Short-term vs long-term averages
-
Distance between price and average
-
Slope consistency over time
-
Interaction with market structure
In crypto markets — where narratives and liquidity cycles often drive extended moves — this structural clarity helps investors avoid fighting momentum.
Key takeaway: Moving averages are alignment tools, not timing mechanisms.
MACD: Momentum Shifts Within Trends
The Moving Average Convergence Divergence (MACD) combines elements of trend and momentum into a single framework. It is derived from the relationship between two EMAs and a signal line, producing both directional and momentum information.
Professionals rarely use MACD to chase crossovers. Instead, they focus on changes in momentum quality.
MACD is most useful for:
-
Identifying momentum acceleration or deceleration
-
Confirming trend continuation
-
Detecting divergence relative to price structure
Because it is calculated from moving averages, MACD remains a lagging indicator — especially on higher timeframes. For this reason, it works best as a confirmation layer, not a trigger.
Key takeaway: MACD helps evaluate trend health, not predict reversals.
Bollinger Bands: Volatility Awareness, Not Direction
Bollinger Bands are frequently misunderstood as reversal tools. In reality, they measure volatility behavior, not directional bias.
The bands plot price relative to a moving average, expanding and contracting based on standard deviation. This answers a different question entirely:
Is volatility compressing or expanding?
Professional Applications
Experienced analysts use Bollinger Bands to:
-
Identify volatility contraction before expansion
-
Assess whether price movement is statistically extreme
-
Adjust position size during unstable regimes
Price touching or exceeding a band does not imply reversal. In strong trends, price can “walk the band” for extended periods without mean reversion.
Key takeaway: Bollinger Bands describe volatility conditions, not turning points.
Average True Range (ATR): Risk Measurement, Not Signal Generation
ATR measures average price movement over a given period. It does not indicate direction, trend, or momentum.
Instead, ATR exists for risk management.
Professionals rely on this metric to:
-
Size positions appropriately
-
Set stop distances relative to volatility
-
Compare risk conditions across assets
-
Avoid overexposure during unstable periods
In crypto — where volatility regimes shift rapidly — ignoring ATR often leads to position sizes that are misaligned with actual risk.
Key takeaway: ATR governs exposure, not entries.
Core Indicators and Their Primary Function
| Indicator | Category | What It Measures | Primary Professional Use |
|---|---|---|---|
| RSI | Momentum | Strength & persistence of price moves | Regime analysis, divergence |
| SMA / EMA | Trend | Directional structure | Trend alignment |
| MACD | Trend + Momentum | Momentum within trend | Continuation confirmation |
| Bollinger Bands | Volatility | Price dispersion | Volatility regimes |
| ATR | Volatility | Average price movement | Risk & position sizing |
Source: CoinMarketCap historical data, Forvest Research (2025)
Why No Single Indicator Works Alone
Crypto markets are multi-dimensional. Price, liquidity, volatility, sentiment, and correlation interact simultaneously. Expecting one indicator to capture all of this information is unrealistic.
Professional frameworks therefore rely on confluence, not complexity.
A well-designed indicator stack typically answers:
-
Is the market trending? (Moving averages)
-
Is momentum supporting that trend? (RSI, MACD)
-
How unstable is participation right now? (ATR, Bollinger Bands)
When indicators conflict, experienced investors reduce exposure rather than forcing decisions.
How Indicators Support Portfolio-Level Decisions
By 2025, indicators are increasingly applied beyond single-asset charts. At the portfolio level, they help investors:
-
Reduce exposure during high-volatility regimes
-
Compare relative strength across assets
-
Adjust allocations based on trend persistence
-
Monitor correlation risk during stress periods
This shift aligns indicators with risk management and allocation logic, rather than speculation.
For readers seeking to integrate indicator interpretation with portfolio clarity, Forvest tools are designed around this philosophy:
How Professionals Combine Indicators Safely (Frameworks, Timeframes & Portfolio Context in 2025)
By 2025, the biggest mistake investors make with technical indicators is no longer choosing the “wrong” indicator. The real danger lies in combining indicators without structure, hierarchy, or context. When indicators are stacked randomly, they amplify noise rather than reduce uncertainty.
Professional investors approach indicators as filters, not decision engines. Each indicator exists to answer a specific question about market behavior. When those questions are mixed, misaligned, or ignored, even the most accurate indicator becomes misleading.
This section explains how indicators are combined responsibly, how timeframe alignment works, why indicators fail in certain environments, and how modern portfolio-level thinking has reshaped indicator usage in crypto markets.
The Core Principle: Indicators Confirm, They Do Not Decide
No professional framework starts with indicators.
Instead, the analytical sequence typically looks like this:
-
Identify market regime (trend, range, transition)
-
Assess liquidity and volatility conditions
-
Align timeframes
-
Use indicators only for confirmation
Indicators are the final layer — not the foundation.
This principle alone eliminates most retail-level mistakes, including overtrading, signal chasing, and emotional decision-making.
Indicator Confluence: Fewer Tools, Clearer Signals
Indicator confluence does not mean using more indicators. It means combining different categories of indicators so that each one answers a unique question.
Poor confluence example (redundant):
-
RSI
-
Stochastic RSI
-
CCI
(All measure momentum → overlapping information)
Professional confluence example:
-
Moving Averages → trend structure
-
RSI → momentum quality
-
ATR → volatility and risk
Each indicator contributes distinct information:
-
Where is the market going? (trend)
-
How strong is participation? (momentum)
-
How unstable is risk? (volatility)
When indicators disagree, professionals usually reduce exposure instead of forcing a trade.
Timeframe Alignment: The Most Ignored Skill in Indicator Use
Timeframe alignment is one of the clearest differences between beginners and professionals.
Professionals never mix signals randomly across timeframes.
A common institutional-style structure:
-
Higher timeframe (weekly / daily):
Defines trend and regime -
Medium timeframe (daily / 4H):
Evaluates momentum and structure -
Lower timeframe (1H / intraday):
Used only for execution or monitoring
If the higher timeframe is bearish, bullish signals on lower timeframes are treated as counter-trend noise, not opportunities.
Ignoring this hierarchy is one of the fastest ways to misinterpret RSI, MACD, or moving average signals.
Trending vs Ranging Markets: Indicators Behave Differently
Indicators do not behave consistently across all market conditions. Understanding regime context is essential.
In Trending Markets:
-
RSI remains elevated or suppressed for long periods
-
Moving averages act as dynamic support or resistance
-
Bollinger Bands expand
-
MACD confirms continuation more than reversals
In Ranging Markets:
-
RSI oscillates between 30–70
-
Moving averages flatten
-
Bollinger Bands contract
-
False breakouts increase
Using mean-reversion tools in trending markets — or trend-following tools in ranges — leads to systematic losses.
Professionals identify the regime first, then decide which indicators are relevant.
When Indicators Fail (And Why That’s Normal)
Indicators fail most often during:
-
Sudden liquidity shocks
-
News-driven volatility
-
Macro announcements
-
Regulatory headlines
-
Exchange outages or forced liquidations
In these moments:
-
Indicators lag
-
Signals conflict
-
Volatility overwhelms historical patterns
Professional response is not to add more indicators. Instead, they:
-
Reduce position size
-
Widen risk limits
-
Stay inactive when uncertainty dominates
Risk management matters more than signal accuracy during instability.
Portfolio-Level Indicator Use: The 2025 Shift
In 2025, indicators are increasingly applied at the portfolio level, not just per asset.
Examples include:
-
Reducing overall exposure during high-volatility regimes
-
Comparing RSI across assets for relative strength
-
Adjusting allocations based on trend persistence
-
Monitoring correlation risk during stress periods
This approach transforms indicators from trade triggers into risk-awareness tools.
Indicator Role by Decision Layer
| Decision Layer | Key Question | Indicators Commonly Used | Purpose |
|---|---|---|---|
| Market Regime | Trend or range? | Moving Averages | Structural context |
| Momentum Quality | Is participation strong? | RSI, MACD | Momentum confirmation |
| Volatility Risk | How unstable is risk? | ATR, Bollinger Bands | Position sizing |
| Portfolio Allocation | Where is strength shifting? | Cross-asset RSI | Allocation bias |
Source: CoinMarketCap historical data, Forvest Research (2025)
Why Simplicity Beats Complexity
Professional indicator setups are often surprisingly simple — not because professionals know less, but because they understand:
-
Most information is redundant
-
More indicators increase noise
-
Clarity improves decision quality
-
Consistency beats complexity
A simple framework applied consistently outperforms a complex one applied emotionally.
Behavioral Discipline: The Hidden Variable
Indicators are only as effective as the behavior of the person using them.
Common behavioral traps include:
-
Forcing trades because “an indicator said so”
-
Ignoring higher-timeframe context
-
Overreacting to short-term signals
-
Adjusting indicators after losses
-
Seeking certainty in probabilistic systems
Professionals treat indicators as decision aids, not authority figures.
Beginner Misuse vs Professional Interpretation
| Indicator | Common Beginner Mistake | Professional Interpretation |
|---|---|---|
| RSI | Selling because RSI > 70 | Evaluate momentum regime |
| Moving Averages | Buying every crossover | Confirm trend direction |
| MACD | Trading every signal cross | Assess momentum quality |
| Bollinger Bands | Expecting reversal at bands | Read volatility behavior |
| ATR | Ignoring it completely | Use for risk sizing |
Source: CoinMarketCap data, academic market structure research, Forvest Analysis (2025)
Final Takeaway: Indicators Are Tools, Not Answers
Successful crypto investors in 2025 do not search for perfect indicators. They build systems that combine:
-
Market structure
-
Risk awareness
-
Timeframe alignment
-
Behavioral discipline
-
A limited set of well-understood indicators
Indicators do not remove uncertainty.
They help you manage it.
That difference defines the line between speculation and strategy — and it is where professional decision-making begins.
Rating of this post
Rate
If you enjoyed this article, please rate it.
FAQs for RSI in Crypto
RSI measures momentum pressure by comparing recent gains to losses. It does not measure value, price targets, or future direction.
Yes, but only when used to analyze momentum regimes and risk context—not as a standalone buy or sell signal.
In strong trends, momentum can remain elevated or suppressed for extended periods. This reflects trend strength, not mispricing.
RSI divergence signals weakening momentum, not guaranteed reversals. Without structure and context, divergence is unreliable.
Professionals use RSI to assess momentum quality, compare assets, and manage risk—never to predict exact tops or bottoms.
Rating of this post
Rate
If you enjoyed this article, please rate it.