
- 1. Structural Stabilization Under Persistent Fear
- Price Action: Progress Without Expansion
- Weekly Market Performance Snapshot
- Compression as a Structural Signal
- Risk Metrics Improved Before Sentiment Did
- Derivatives & Risk Reset Overview
- Sentiment: Fear That No Longer Accelerates
- Liquidity: Constrained, Not Impaired
- Structural Takeaway
- 2. Market Internals Breakdown — Liquidity, Flows, and Behavioral Signals
- Liquidity Conditions: Thin, Controlled, and Uneven
- Exchange Flows: Optional Supply, Not Forced Selling
- Exchange Flow Interpretation Framework
- Derivatives Markets: Deleveraging Without Stress
- Derivatives Reset Snapshot
- Stablecoin Supply: Latent Liquidity, Not Activation
- Sentiment Structure: Fear That Plateaus
- Behavioral Shift: From Reaction to Observation
- Structural Synthesis: A Defensive Equilibrium
- Why This Internal Phase Matters
- 3. Market Implications & Forward Signals — What the Data Is Quietly Suggesting
- Stabilization Through Structure, Not Price
- Liquidity as the Limiting Factor
- Institutional Positioning: Adjusting, Not Abandoning
- Why This Is Not a Bottom — Yet
- Why This Is Also Not a Breakdown
- Structural Signal Summary
- What to Monitor Going Forward (Without Forecasting)
- Final Perspective
- Closing Note
1. Structural Stabilization Under Persistent Fear
The trading period from December 29, 2025 to January 5, 2026 did not mark a turning point for crypto markets — but it did mark a shift in how risk was handled.
Rather than delivering breakouts, capitulation, or narrative-driven momentum, the market transitioned into a quieter phase defined by balance. Prices moved higher, but without acceleration. Volatility eased, but did not collapse. Sentiment remained fearful, yet stopped deteriorating.
This combination is not random. It reflects a market moving away from instability and toward structural stabilization, even as confidence remains absent.
Price Action: Progress Without Expansion
On the surface, weekly performance appeared constructive:
-
Bitcoin advanced modestly on the week
-
Ethereum outperformed, posting stronger relative gains
-
Total crypto market capitalization reclaimed levels above $3 trillion
Yet price behavior lacked the defining characteristics of trend initiation.
There were no impulsive continuation moves, no volatility expansion, and no aggressive follow-through after resistance breaks. Instead, price appreciation unfolded gradually within controlled ranges.
This is best described as price improvement without conviction.
Weekly Market Performance Snapshot
| Asset | Weekly Change | Weekly High | Weekly Low | Structural Interpretation |
|---|---|---|---|---|
| Total Crypto Market Cap | +4.0% | ~$3.14T | ~$2.85T | Compression / equilibrium |
| Bitcoin (BTC) | +2.4% | ~$93.2K | ~$87.1K | Range-bound stabilization |
| Ethereum (ETH) | +4.5% | ~$3.17K | ~$2.93K | Correlated recovery |
Price compression of this nature typically emerges when opposing forces temporarily balance:
-
Sellers reduce exposure selectively
-
Buyers accumulate cautiously
-
Liquidity absorbs volatility without distortion
The result is stability — not strength.
Compression as a Structural Signal
Compression is often misinterpreted as indecision. Structurally, it often reflects risk digestion.
Throughout the week:
-
Bitcoin respected a well-defined range without invalidating prior structure
-
Ethereum maintained high correlation without introducing independent pressure
-
Broader market beta remained muted despite macro developments
This environment suggests that participants were not attempting to front-run direction. Instead, they were adjusting exposure and waiting for confirmation.
Key characteristics of compression phases include:
-
Reduced volatility without volatility collapse
-
Narrow ranges with frequent intraday oscillation
-
Absence of momentum chasing on both sides
These conditions rarely mark tops or bottoms — but they often separate stress from resolution.
Risk Metrics Improved Before Sentiment Did
One of the most important signals during this period came not from price, but from risk behavior.
From a structural perspective, Bitcoin’s risk profile improved before sentiment did — a dynamic also reflected in Forvest’s Bitcoin Trust Score, which aggregates liquidity conditions, leverage behavior, exchange flows, and on-chain risk signals to assess underlying market health.
Derivatives markets showed early stabilization:
-
Futures open interest remained elevated but flat
-
Funding rates normalized near neutral levels
-
Liquidations occurred without cascading effects
-
Options expiries passed without repricing shocks
This sequence matters.
In structurally fragile markets, leverage typically rebuilds quickly after relief rallies, increasing downside risk. During this week, leverage compression occurred before sentiment improved — and leverage did not rush back.
Derivatives & Risk Reset Overview
| Metric | Weekly Behavior | Structural Signal |
|---|---|---|
| Open Interest | Flat | No leverage rebuild |
| Funding Rates | Near neutral | Balanced positioning |
| Liquidations | Moderate, early | Risk flush completed |
| Options Expiry | Orderly | No structural stress |
This indicates restraint — a sign that participants prioritized risk control over opportunity.
Sentiment: Fear That No Longer Accelerates
Sentiment remained cautious throughout the week, with the Crypto Fear & Greed Index averaging in the low-to-mid 20s.
What changed was not fear itself, but its trajectory.
-
No new sentiment lows were printed
-
Emotional reactions weakened despite price fluctuations
-
Social engagement remained subdued
Markets tend to destabilize when fear accelerates rapidly. This week showed the opposite: fear persisted, but stopped deepening.
This distinction matters:
-
Panic-driven markets often cascade
-
Fatigue-driven markets tend to consolidate
The observed sentiment behavior aligned clearly with the latter.
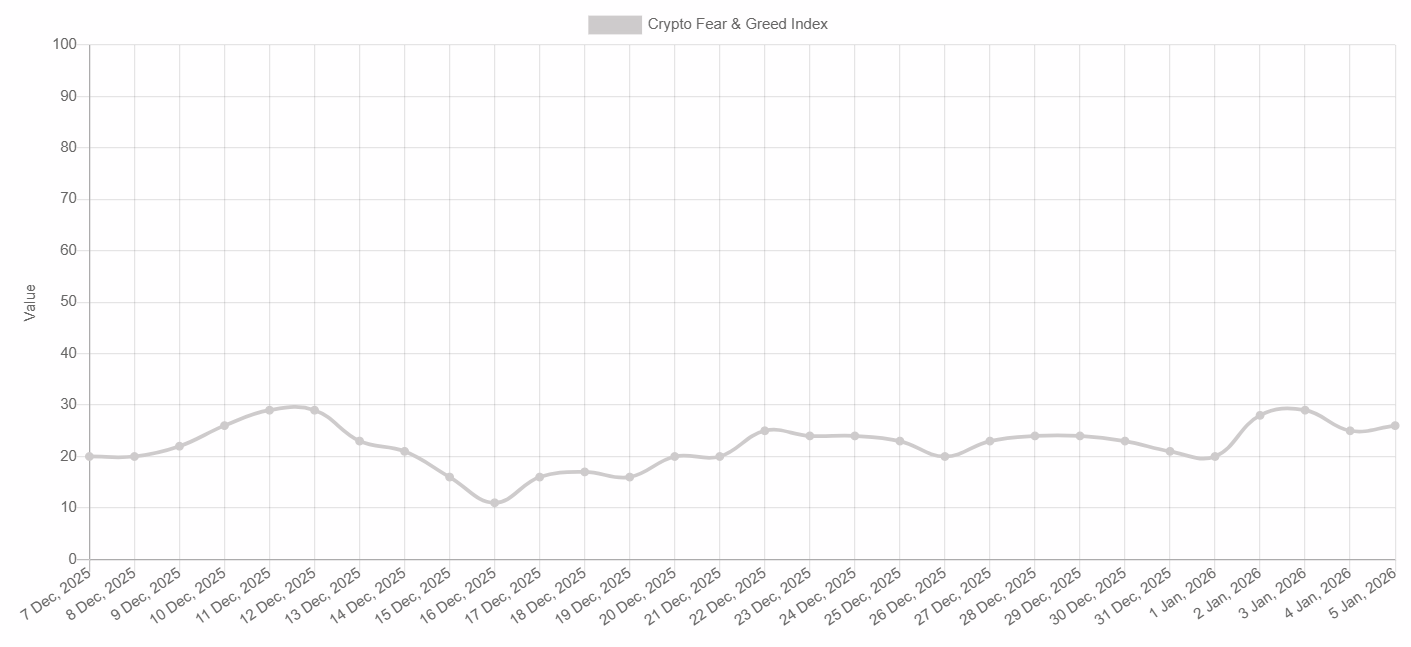
Source: alternative.me – Crypto Fear & Greed Index
Liquidity: Constrained, Not Impaired
Year-end liquidity conditions were predictably thin, yet functionality remained intact.
Observed liquidity behavior included:
-
Reduced spot volumes across major venues
-
Intact order books on top-tier exchanges
-
Stable bid–ask spreads within historical norms
-
Absence of disorderly gaps or liquidity vacuums
Thin liquidity alone does not destabilize markets. Fragile liquidity does.
During this period, liquidity limited follow-through but did not impair price discovery. Upside attempts lacked depth, while downside pressure lacked urgency — reinforcing a range-bound structure.
Structural Takeaway
Taken together, the data points to a market that was resetting internally:
-
Price stabilized without acceleration
-
Leverage cooled without rebuilding
-
Liquidity constrained outcomes without breaking
-
Fear stabilized without collapsing
This is not a bullish structure.
It is not a bearish breakdown.
It is a structural reset phase — the zone where markets absorb prior stress and re-establish balance before direction becomes clear.
These phases often feel uneventful.
They are also where durable moves begin forming — quietly.
2. Market Internals Breakdown — Liquidity, Flows, and Behavioral Signals
While price action during the Dec 29, 2025 – Jan 5, 2026 window appeared constructive, the more meaningful signals emerged beneath the surface. Internal market mechanics — liquidity conditions, exchange flows, leverage behavior, and participant psychology — provided critical context for why prices advanced without triggering directional conviction.
This was not a week defined by momentum.
It was a week defined by constraint and control.
Capital did not rush in, nor did it flee. Instead, it repositioned cautiously within tighter structural boundaries.
Liquidity Conditions: Thin, Controlled, and Uneven
Liquidity often determines how markets move — not where they should move. During this period, liquidity conditions reflected year-end realities while maintaining functional integrity.
Spot volumes declined across major venues, but the decline did not impair market mechanics.
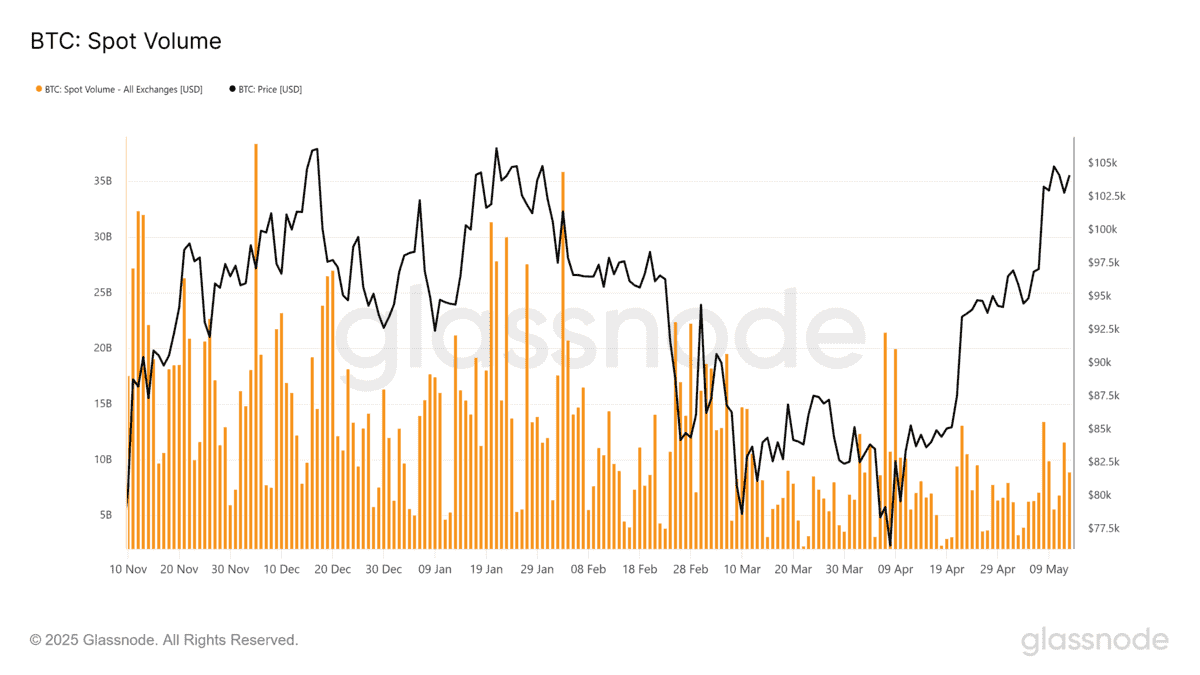
Key characteristics observed:
-
Order books remained intact on top-tier exchanges
-
Bid–ask spreads widened marginally but stayed within historical norms
-
Market orders caused sharper intraday moves, yet lacked continuation
-
No liquidity vacuum events or disorderly gaps appeared
This combination matters.
Thin liquidity alone does not destabilize markets. Fragile liquidity does. During this week, liquidity was constrained but resilient.
In practical terms:
-
Price could move
-
But it could not absorb large shocks without short-term volatility
That distinction explains why price oscillated within ranges instead of trending decisively.
Exchange Flows: Optional Supply, Not Forced Selling
Exchange flow data is frequently misinterpreted as an immediate sell signal. Structurally, it reflects availability, not intent.
Throughout the week:
-
Bitcoin exchange reserves remained near multi-year lows
-
Net flows were modest and dispersed across days
-
No single-session deposit surge occurred
This behavior carries important implications.
Gradual inflows suggest participants were positioning optional liquidity near trading venues, not exiting positions en masse. Traders appeared to prepare for volatility windows rather than responding to stress.
Exchange Flow Interpretation Framework
| Flow Pattern | Observed Behavior | Structural Meaning |
|---|---|---|
| Gradual inflows | Spread across multiple days | Risk management positioning |
| Stable reserves | Near cycle lows | Long-term holding preference |
| No deposit spikes | Absence of panic | Confidence not broken |
Rather than signaling imminent sell pressure, exchange data pointed to tactical readiness — a hallmark of defensive environments.
Derivatives Markets: Deleveraging Without Stress
Derivatives markets often expose fragility before spot markets react. During this week, they told a notably calmer story.
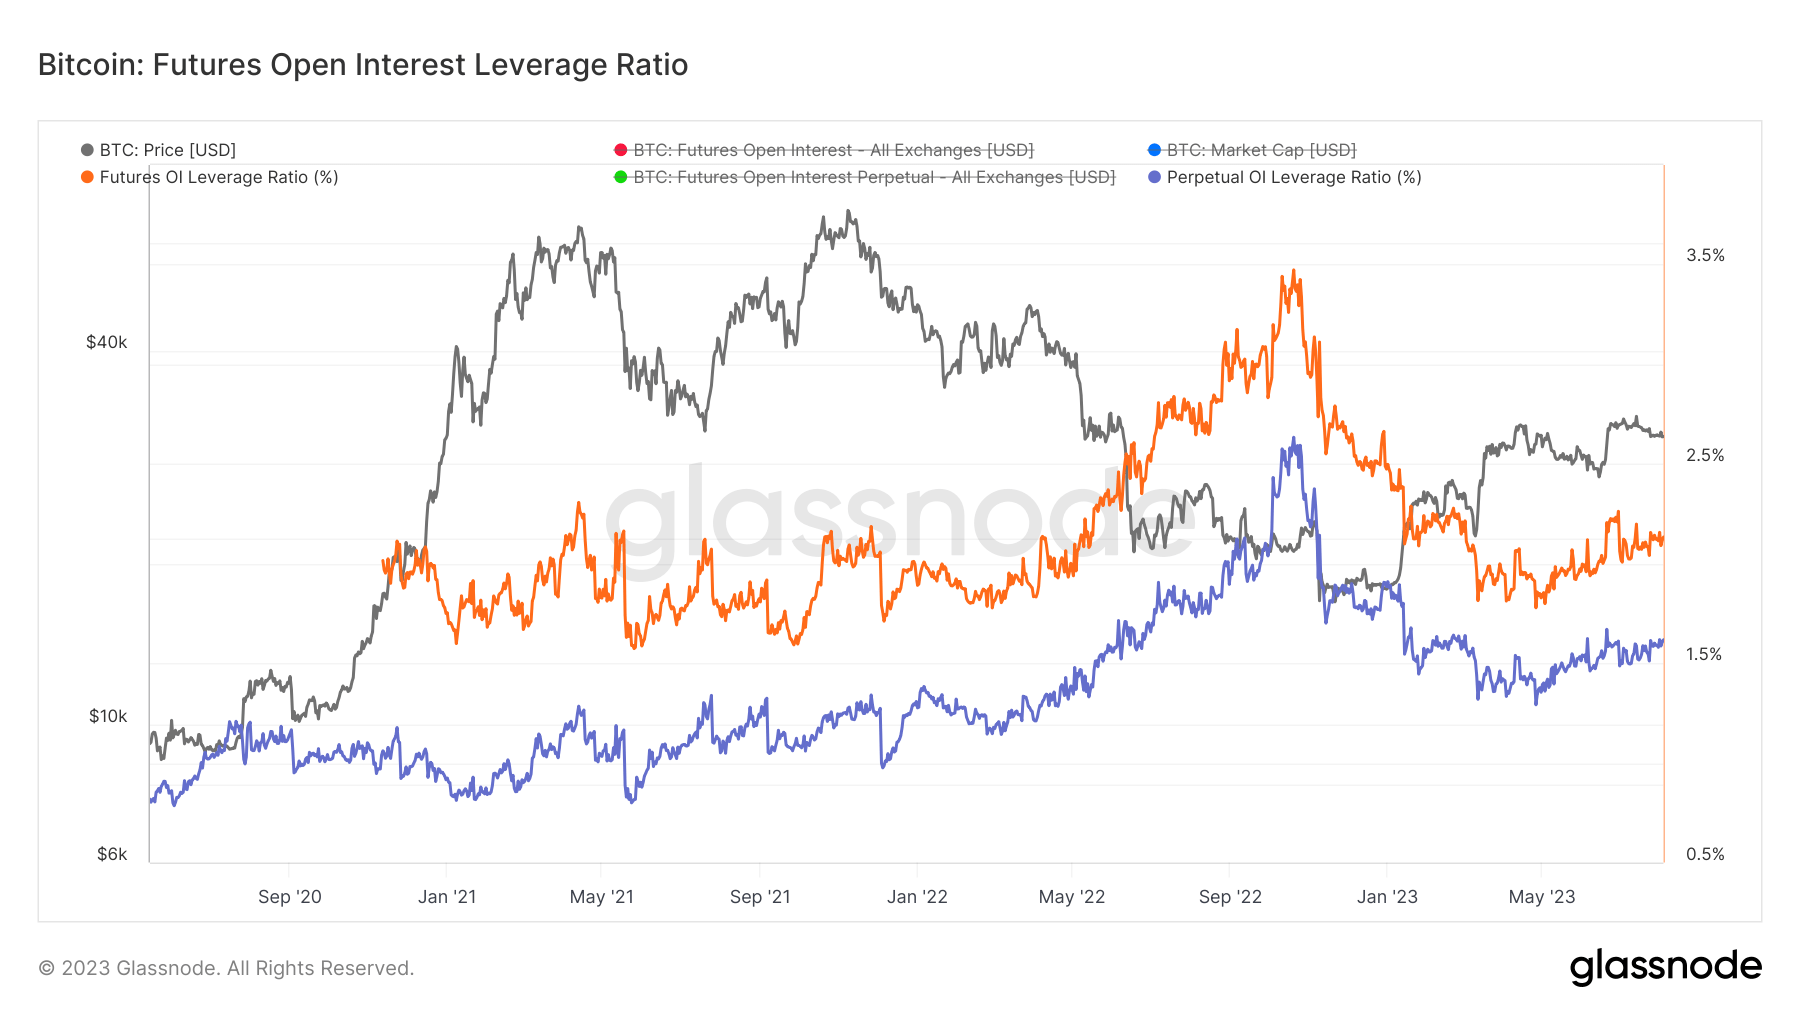
Key dynamics included:
-
Futures open interest remained flat
-
Funding rates hovered near neutral
-
Liquidations occurred early, not late
-
Options expiry passed without repricing shock
The sequence of these events is critical.
Leverage reduction occurred before sentiment stabilized — not after. This order historically reduces downside acceleration risk, as forced selling pressure is resolved early rather than compounding losses later.
Derivatives Reset Snapshot
| Metric | Weekly Trend | Interpretation |
|---|---|---|
| Open Interest | Flat | No leverage rebuild |
| Funding Rates | Neutral | Balanced positioning |
| Liquidations | Moderate, early | Forced risk exit completed |
| Options Expiry | Heavy but orderly | No structural stress |
In unstable markets, leverage often rebuilds prematurely. This week showed the opposite: restraint.
Stablecoin Supply: Latent Liquidity, Not Activation
Stablecoin market capitalization remained elevated but largely unchanged during the period.
Key observations:
-
Total stablecoin supply held near all-time highs
-
USDT and USDC balances were flat week-over-week
-
No sudden issuance or redemption spikes occurred
This indicates latent liquidity — capital waiting, not deploying.
Historically, rising stablecoin supply without deployment often precedes consolidation rather than immediate price expansion. The capital exists, but conviction does not.
This aligns with broader behavioral patterns observed across markets during the week.
Sentiment Structure: Fear That Plateaus
Sentiment remained cautious, but its rate of change slowed.
Notable sentiment characteristics:
-
Fear & Greed Index improved modestly
-
No new sentiment lows were printed
-
Social volume remained subdued
-
Emotional responses decoupled from minor price moves
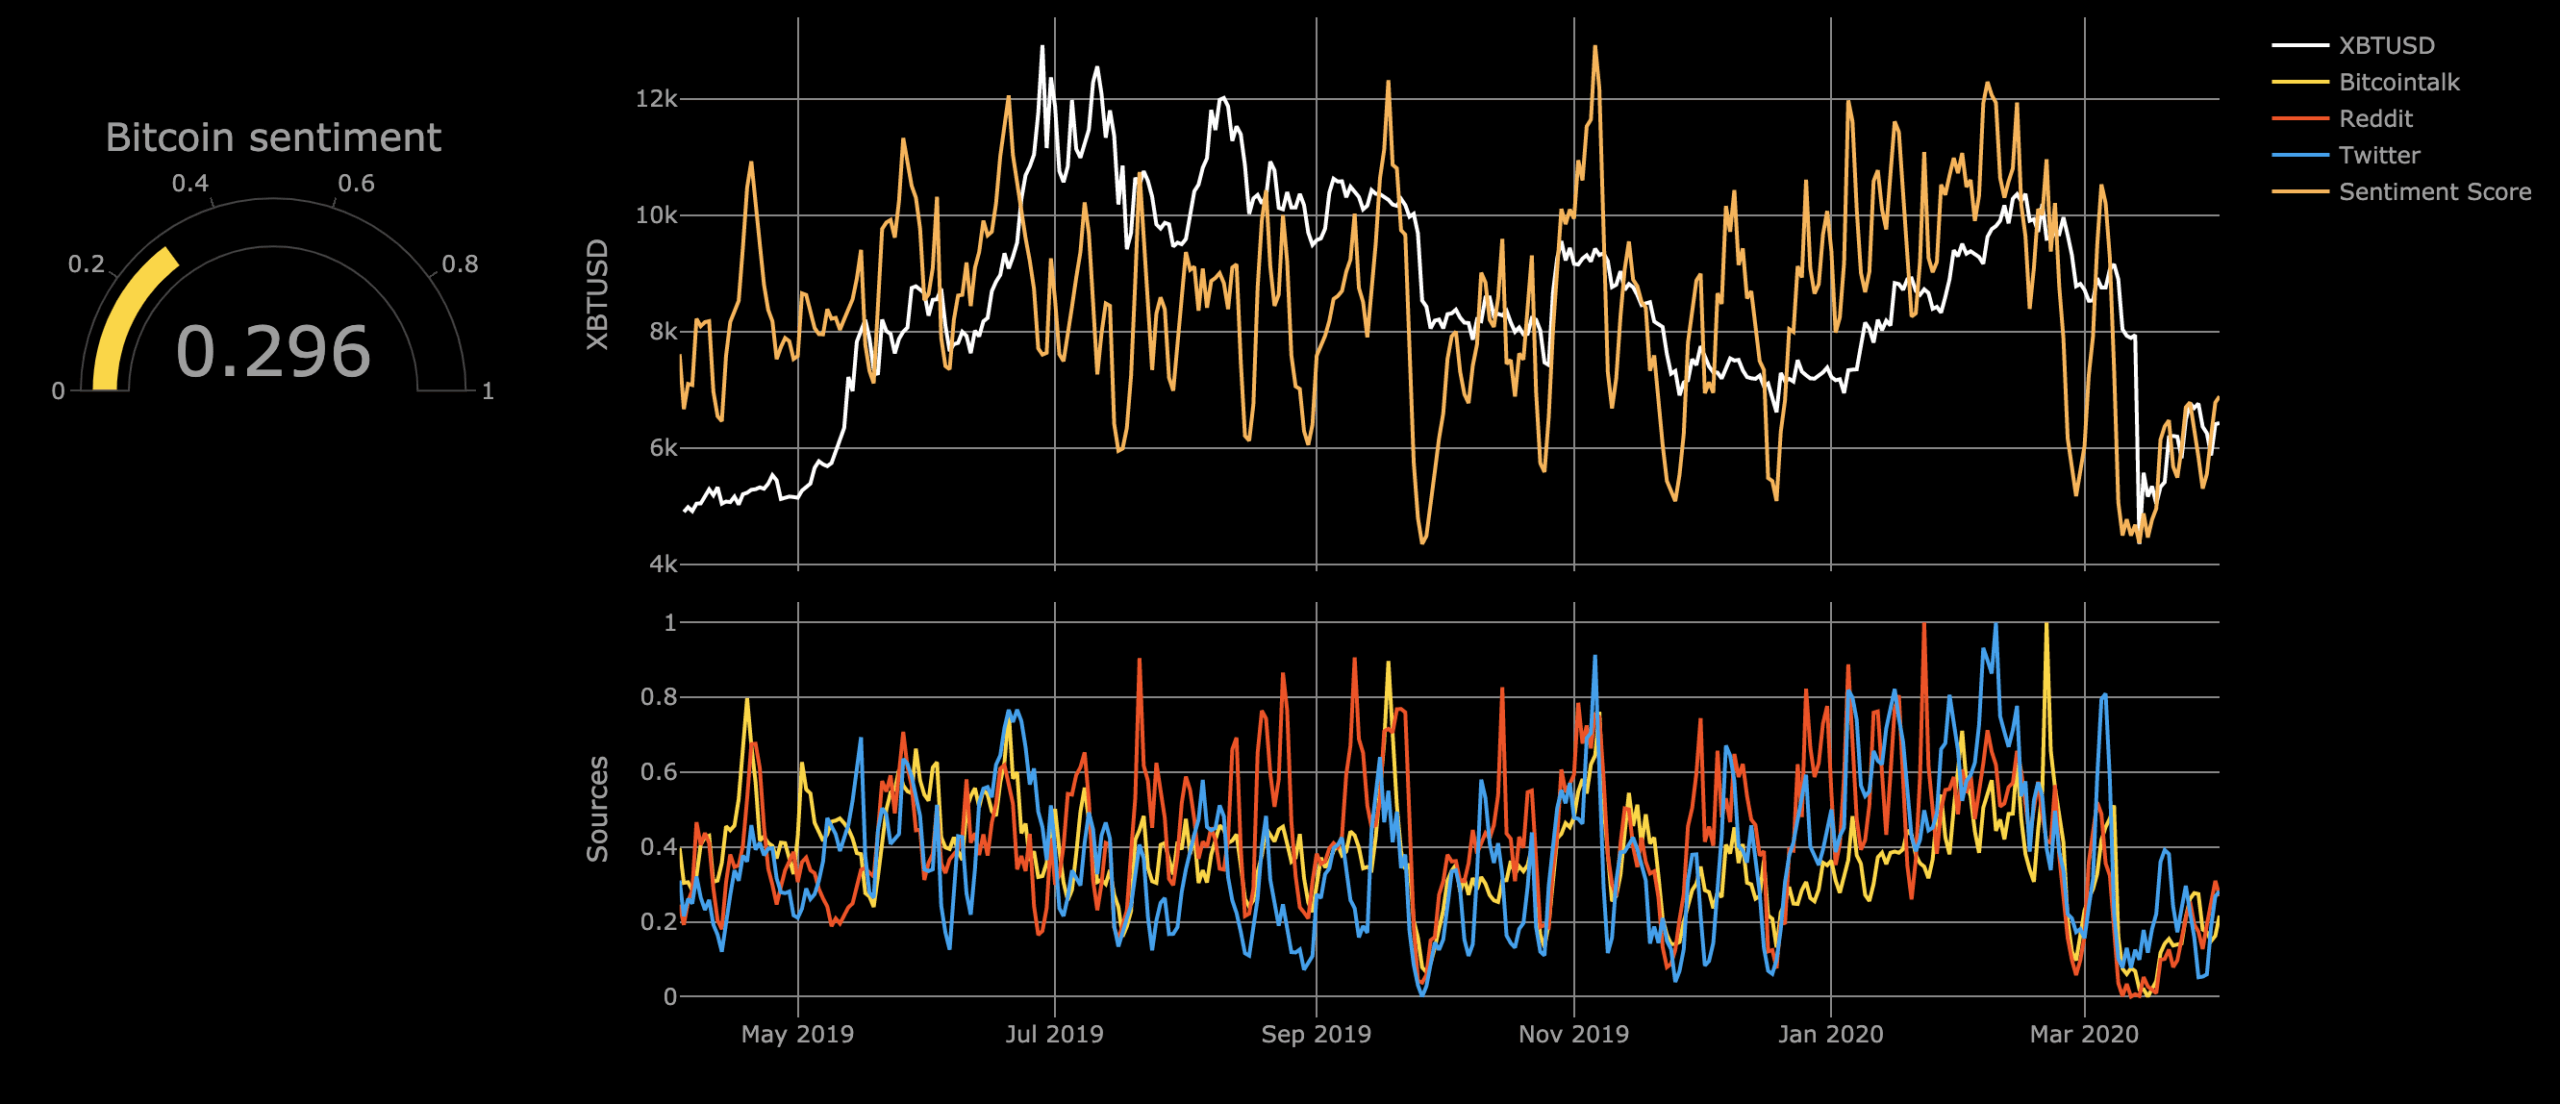
Markets tend to destabilize when fear accelerates rapidly. This week showed the opposite: fear persisted, but stopped deepening.
That distinction suggests emotional fatigue, not capitulation.
-
Fatigue-driven markets typically consolidate
-
Panic-driven markets typically cascade
This week aligned clearly with the former.
Behavioral Shift: From Reaction to Observation
One of the most subtle — and important — changes occurred at the behavioral level.
Participants:
-
Reacted less aggressively to price fluctuations
-
Waited for confirmation instead of chasing moves
-
Shifted focus toward explanations rather than action
This transition from reaction to observation often marks the midpoint between trend exhaustion and trend resolution.
It does not guarantee direction.
But it reduces instability.
Markets in this phase are less prone to disorderly moves and more sensitive to external catalysts rather than internal stress.
Structural Synthesis: A Defensive Equilibrium
When liquidity, flows, leverage, and sentiment are viewed together, a consistent picture emerges:
-
Supply became selective, not indiscriminate
-
Leverage pressure eased without rebuilding
-
Liquidity remained functional despite thin volumes
-
Fear stabilized without collapsing
This is not a bullish structure.
It is not a bearish breakdown.
It is a reset structure.
Markets in this phase are highly sensitive to macro data, policy signals, and liquidity shifts — but internally, they are no longer unstable.
Because crypto markets transition structurally before price narratives adjust, Forvest’s Weekly Crypto Market Review focuses on liquidity, leverage, and behavioral signals rather than short-term price moves.
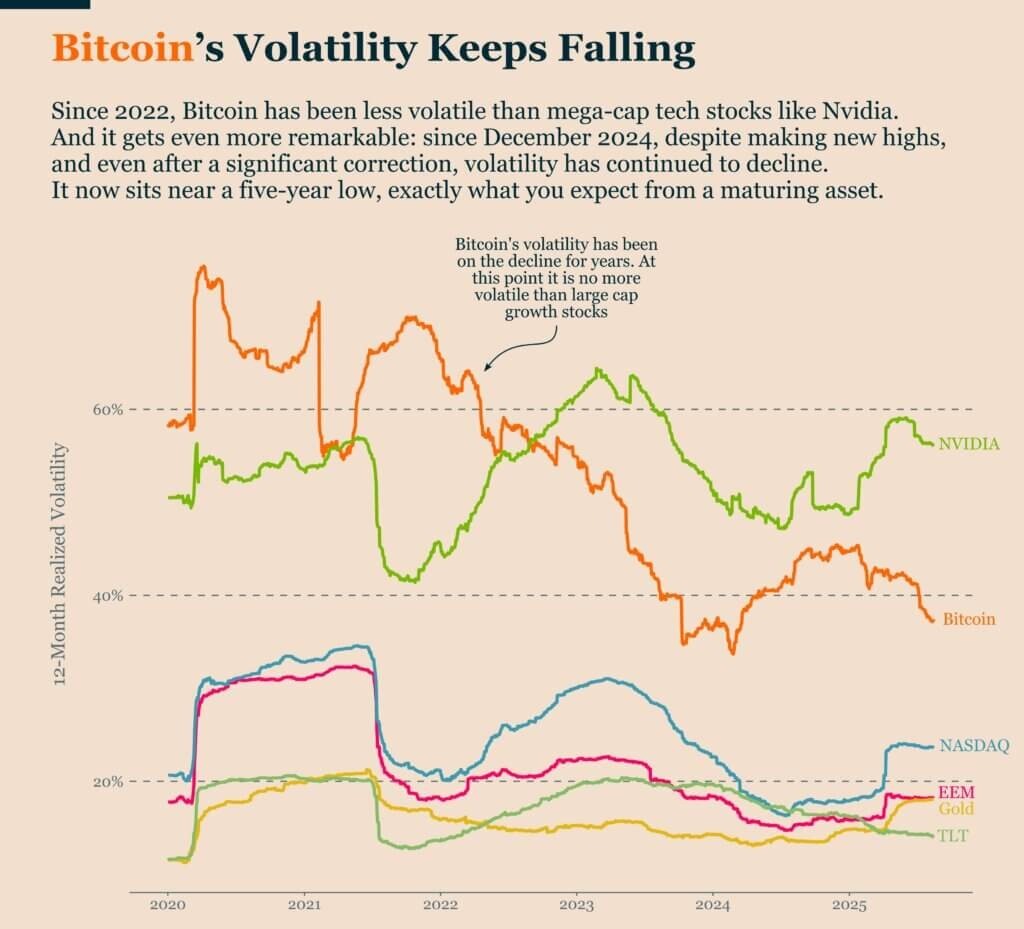
Bitcoin’s realized volatility has continued to decline, signaling a structurally calmer market environment despite ongoing price fluctuations. Source: Ecoinometrics
Why This Internal Phase Matters
This environment is challenging precisely because it feels uneventful.
-
Nothing breaks
-
Nothing resolves
-
Everything waits
Understanding this phase helps distinguish:
-
Structural resets vs. false recoveries
-
Defensive positioning vs. speculative risk-taking
Internal market mechanics often shift before price narratives catch up. This week illustrated how stabilization can occur quietly, without headlines or momentum.
3. Market Implications & Forward Signals — What the Data Is Quietly Suggesting
By the close of the December 29, 2025 – January 5, 2026 window, crypto markets had not delivered resolution — but they had delivered something arguably more valuable: context.
Not context in the form of breakouts or trend reversals, but insight into how risk is being handled, how capital is positioned, and how participants behave after stress. These signals often matter most before direction becomes obvious.
At this stage, framing the market as bullish or bearish oversimplifies reality.
The more useful question is structural:
What conditions are forming beneath the surface?
Periods of structural reset highlight the importance of disciplined portfolio risk management, where exposure is adjusted based on internal conditions rather than price narratives.
Stabilization Through Structure, Not Price
One of the defining characteristics of this week was that stabilization emerged without a decisive price breakout.
Historically, meaningful market transitions tend to follow a recognizable sequence:
-
Sharp price decline
-
Leverage reduction
-
Structural rebalancing
-
Sentiment fatigue
-
Gradual stabilization
-
Directional resolution
Based on observed data, the market currently sits between structural rebalancing and sentiment fatigue.
Key signals reinforcing this positioning:
-
Leverage was reduced early and did not rebuild
-
Exchange flows remained moderate and controlled
-
Whale activity shifted toward redistribution, not exit
-
Fear persisted, but failed to intensify
This combination reflects risk digestion, not accelerating stress.
Importantly, stabilization occurred at the structural level — not because demand surged, but because fragility diminished.
Liquidity as the Limiting Factor
Liquidity did not disappear during this period — but it clearly constrained outcomes.
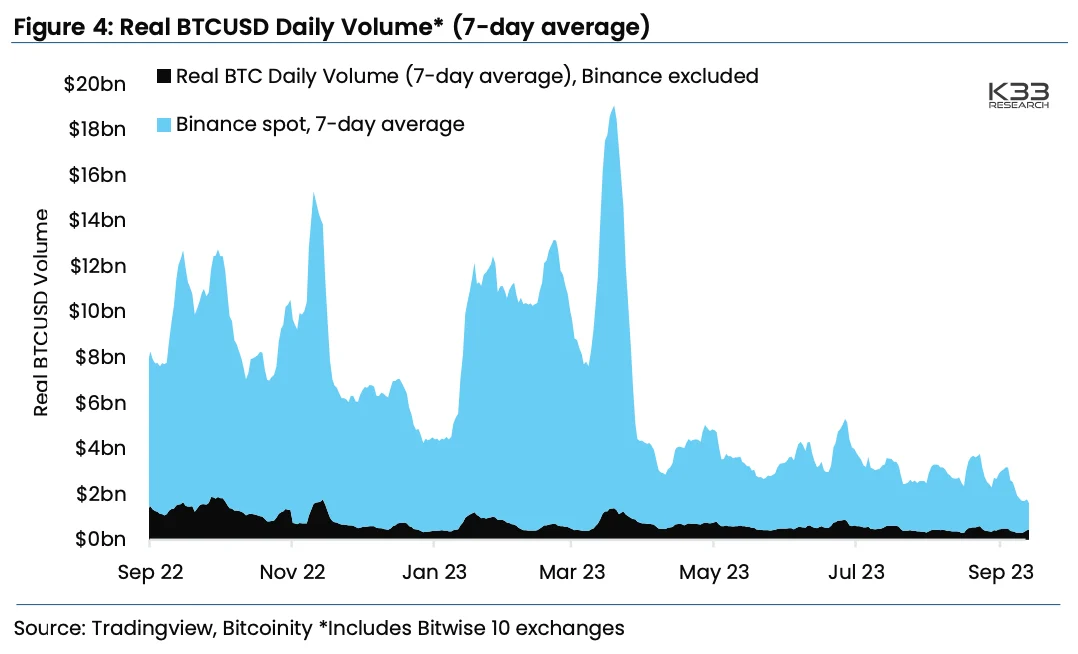
Observed liquidity behavior:
-
Thin spot volumes limited directional follow-through
-
Order books absorbed volatility without breakdown
-
Derivatives liquidity normalized after early-week stress
This created a range-bound environment where price could move, but only briefly.
In practical terms:
-
Upside attempts lacked depth
-
Downside pressure lacked urgency
Markets in this condition often remain directionless until an external catalyst emerges — macro data, policy signals, or liquidity shifts — rather than internal stress forcing resolution.
Institutional Positioning: Adjusting, Not Abandoning
Institutional behavior provided another critical layer of context.
Despite negative fund flows in certain regions:
-
Large wallet cohorts continued selective accumulation
-
ETF outflows were measured, not disorderly
-
No evidence of forced institutional exit appeared
This distinction matters.
Institutions adjusting exposure behave fundamentally differently from institutions abandoning exposure. This week aligned clearly with the former.
Ownership appeared to transition gradually rather than collapse, reinforcing the broader theme of reallocation instead of retreat.
Why This Is Not a Bottom — Yet
Precision matters.
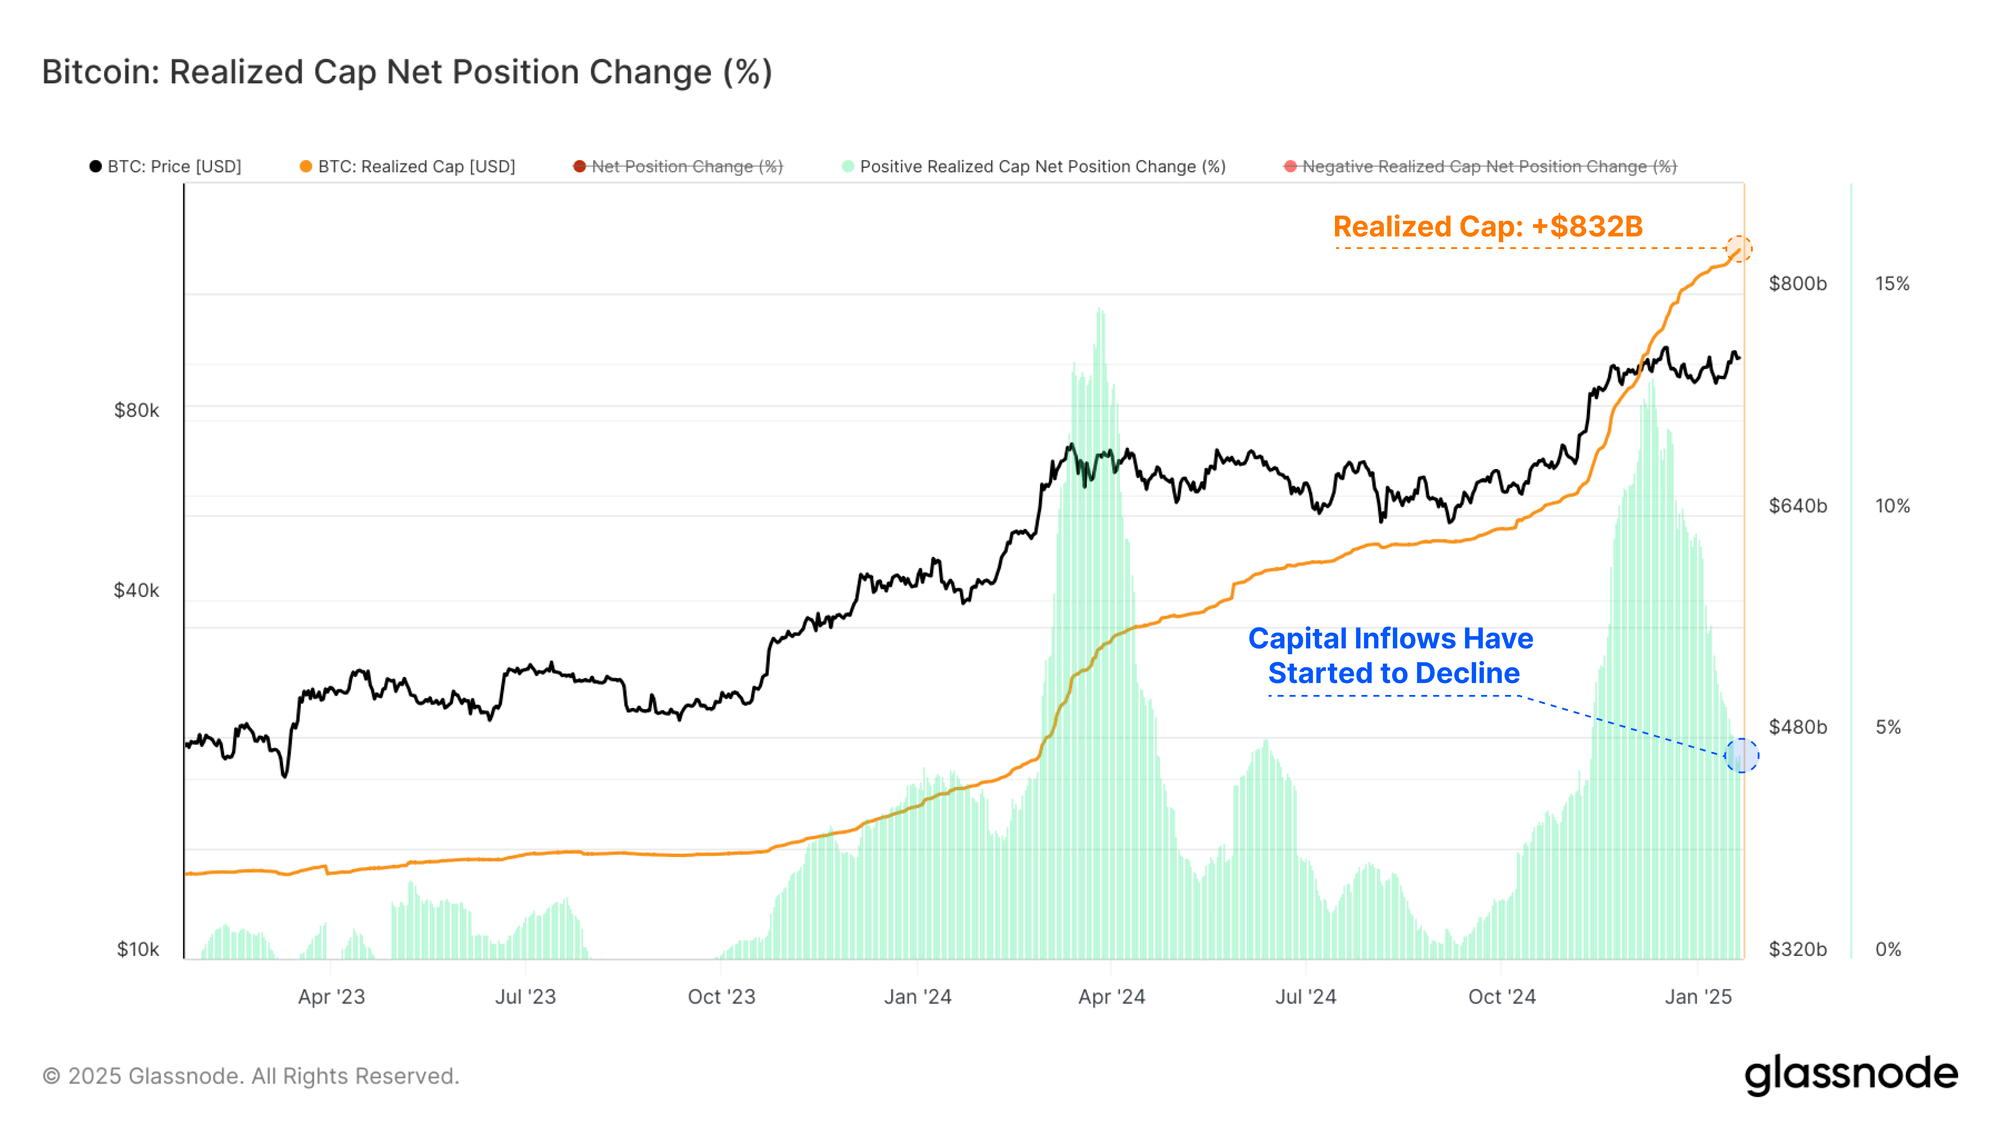
The data does not confirm a definitive market bottom.
Classic bottom characteristics remain absent:
-
No volume climax
-
No broad capitulation
-
No sentiment collapse across channels
Instead, the market reflects hesitation and fatigue.
This distinction is critical because:
-
Fatigue tends to lead to consolidation
-
Capitulation tends to lead to reversals
Until one of those states clearly emerges, markets often remain reactive and range-bound.
Why This Is Also Not a Breakdown
At the same time, structural data does not support renewed collapse.
Key stabilizing factors remain intact:
-
Selling pressure became selective
-
Exchange balances changed slowly
-
Leverage stress resolved quickly
-
Liquidity remained functional
This significantly reduces the probability of uncontrolled downside without a new catalyst.
Markets that break typically do so when leverage expands, liquidity fractures, and sentiment accelerates downward. None of those conditions were present during this window.
Structural Signal Summary
| Structural Layer | Observed Condition | Implication |
|---|---|---|
| Leverage | Reduced, not rebuilt | Lower downside acceleration risk |
| Whale Behavior | Redistribution | Ownership transition underway |
| Exchange Flows | Gradual, controlled | Tactical positioning |
| Sentiment | Fear plateaus | Fatigue, not panic |
| Liquidity | Thin but stable | Volatility compression |
Viewed together, these signals describe a market that is internally repaired, but not yet externally resolved.
What to Monitor Going Forward (Without Forecasting)
Rather than projecting price targets, the data suggests monitoring conditions.
Key forward-facing indicators include:
-
Exchange balance trends
-
Sustained rise → increased supply risk
-
Stabilization or decline → reduced sell pressure
-
-
Whale cohort behavior
-
Continued growth in 1K–10K BTC wallets → accumulation bias
-
-
Leverage dynamics
-
Rapid funding spikes → structural fragility
-
Gradual rebuild → healthier participation
-
-
Sentiment compression
-
Prolonged fear without price breakdown → exhaustion signal
-
No single metric defines direction — but together, they define readiness.
In environments where markets remain range-bound, tracking on-chain risk signals and market stress indicators becomes more valuable than forecasting price direction.
Final Perspective
The December 29 – January 5 period did not resolve the crypto market — and that is precisely why it matters.
What shifted was not price, but structure:
-
Risk was reduced
-
Ownership redistributed
-
Fear stabilized
-
Liquidity normalized
These are the conditions markets typically require before decisive moves occur.
Whether the next phase brings expansion or renewed pressure will depend less on headlines — and more on how these internal dynamics evolve.
Closing Note
Forvest Weekly Crypto Market Review focuses on structure, not speculation.
By tracking liquidity, leverage, institutional flows, and sentiment together, Forvest Research aims to cut through short-term noise and highlight how markets actually transition — often before direction becomes obvious.
Stay informed.
Stay data-driven.
Follow Forvest for clarity beyond the headlines.
FAQs for Weekly Crypto Analysis (Dec 29 – Jan 5, 2025)
Current structural data does not confirm a definitive crypto market bottom. Key bottoming signals such as volume climax, broad capitulation, and sentiment collapse remain absent. Instead, market behavior reflects fatigue and consolidation rather than reversal dynamics. Until capitulation-driven conditions emerge, price action is more likely to remain range-bound.
A structural reset refers to a phase where internal market stress is absorbed without a trend resolution. During this phase, leverage is reduced, liquidity remains functional, selling becomes selective, and sentiment stabilizes without improving. Structural resets often occur between periods of volatility and precede directional moves, but they do not imply immediate bullish or bearish outcomes.
Prices can rise modestly without initiating a trend when liquidity is constrained, leverage is restrained, and participation remains cautious. In such environments, price movement reflects balance rather than conviction. Without volatility expansion, momentum participation, or capital inflow acceleration, upward price action lacks the structural support needed for trend formation.
Liquidity determines how far price can move, not where it should go. Thin but functional liquidity limits follow-through in both directions, creating range-bound behavior. Markets typically remain directionless under constrained liquidity until an external catalyst — such as macroeconomic data, policy changes, or liquidity injections — alters participation conditions.
After consolidation, investors should monitor exchange balance trends, whale cohort behavior, leverage dynamics, funding rate changes, and sentiment compression. No single indicator defines direction, but alignment across liquidity, leverage, and behavioral metrics often signals whether markets are preparing for expansion or renewed stress.
Rating of this post.
Rate
If you enjoyed article, please rate it.


