
Short answer: The best crypto technical-analysis tool is the one that matches your data, timeframe and workflow. Compare exchange coverage, charting, indicators, alerts, backtesting, exports, security and total cost; do not choose from the longest feature list.
| Primary need | Tool category | Minimum capability |
|---|---|---|
| Manual charting | Chart platform | Reliable candles, drawing, layouts and alerts |
| Rule testing | Backtest/research platform | Fees, slippage, export and reproducible rules |
| Market screening | Market-data screener | Transparent exchange coverage and filters |
| Derivatives context | Derivatives analytics | Funding, open interest and liquidation methodology |
| Portfolio decisions | Portfolio/risk platform | Positions, exposure, drawdown and alerts |
Technical charting, on-chain analysis, sentiment and portfolio monitoring are different jobs. A tool can be excellent at one and unsuitable for another.
Cryptocurrency Technical Analysis Tools and Workflow-Based Selection
Cryptocurrency markets generate a continuous flow of information. Price movements, trading volume, volatility changes, and market activity can shift quickly, making it challenging for investors and traders to evaluate market conditions without organized analytical workflows.
Technical analysis tools help transform this raw market information into structured charts, indicators, alerts, and research environments. Instead of manually tracking multiple assets and data points, these platforms allow users to analyze historical price behavior, identify market patterns, and build a more consistent analysis process.
However, choosing the right cryptocurrency technical analysis tool is not simply about selecting the platform with the highest number of indicators or the largest feature list.
Different users analyze markets with different objectives.
A day trader monitoring short-term price movements may prioritize fast charts, customizable layouts, technical indicators, and real-time alerts.
A long-term investor may focus more on historical data, multi-timeframe analysis, broader market visibility, and research flexibility.
Because these workflows are different, the most suitable platform depends on how users analyze cryptocurrency markets, what information they require, and which features support their decision-making process.
The “best” technical analysis tool is therefore not universal.
A platform with hundreds of indicators may provide less value if those features do not match the user’s analytical workflow.
A better evaluation question is:
Which cryptocurrency technical analysis tool provides the right combination of data, features, and workflow support for the way you analyze markets?
This approach helps users compare technical analysis platforms based on their actual needs rather than popularity, brand recognition, or feature quantity alone.
Instead of searching for a single “best” platform, users should evaluate different tools based on platform comparison criteria, required data sources, charting workflow, indicator selection needs, and possible limitations.
Crypto Technical Analysis Workflow Fit Framework
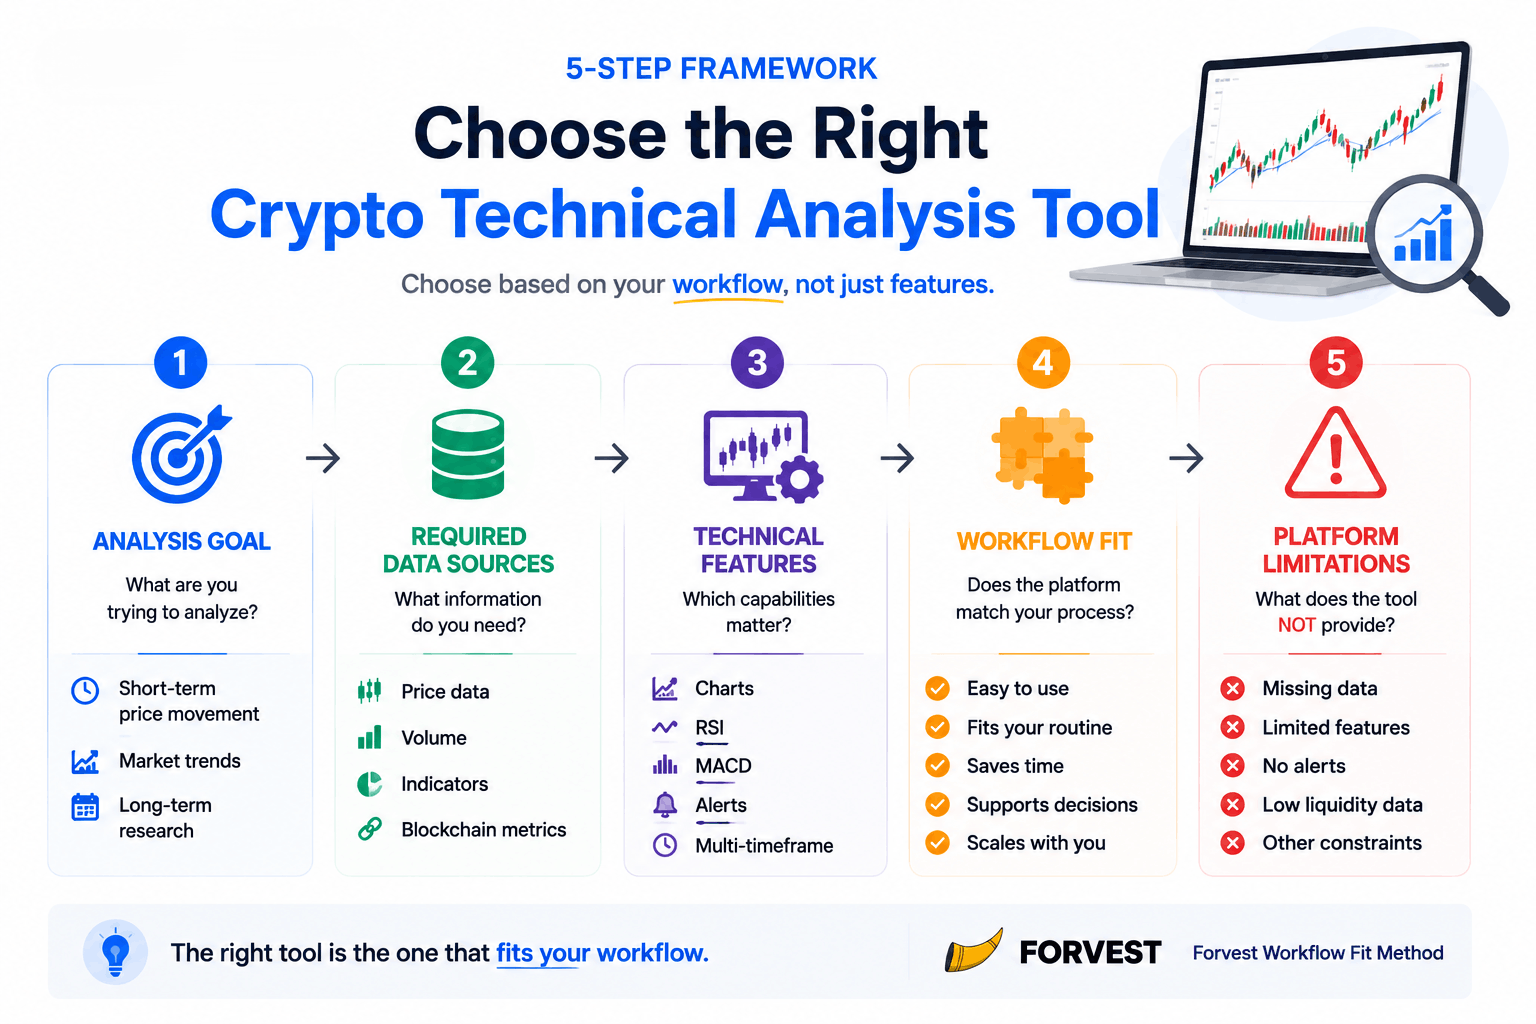
A useful way to evaluate these platforms is through a workflow-based framework:
| Evaluation Area | Question to Ask | Why It Matters |
|---|---|---|
| Analysis Goal | What type of market analysis am I performing? | Determines which tools and features are relevant |
| Data Requirements | Which market information do I need? | Prevents choosing platforms with unnecessary or missing data |
| Technical Features | Which indicators and charting capabilities support my process? | Helps match platform capabilities with research needs |
| Workflow Fit | How easily does the platform support my analysis routine? | Improves consistency and efficiency |
| Platform Limitations | What does this tool not provide? | Creates realistic expectations before choosing a platform |
Using this evaluation process makes it easier to understand why different cryptocurrency technical analysis tools serve different users.
For example, a beginner may need simple charts, basic indicators, and an easy-to-understand interface. A day trader may prioritize advanced chart layouts, alerts, and faster market monitoring. A long-term investor may require historical data, multi-timeframe analysis, and broader research capabilities.
The same cryptocurrency market can require different tools depending on the user’s analysis workflow.
In the following sections, this article compares leading cryptocurrency technical analysis platforms, including charting platforms, market data tools, and multi-exchange solutions, to explain how different tools support different research approaches.
What Are Cryptocurrency Technical Analysis Tools?
Cryptocurrency technical analysis tools are software platforms that help users study market behavior through price data, trading activity, chart patterns, and technical indicators.
These platforms organize market information through visual dashboards and analytical features that make price movements easier to evaluate.
Common capabilities include:
- Candlestick charts
- Moving averages
- Relative Strength Index (RSI)
- MACD
- Bollinger Bands
- Fibonacci retracement tools
- Volume analysis
- Watchlists
- Price alerts
Each feature supports a different part of the analysis process.
For example, candlestick charts help users visualize price movement over time. RSI and MACD provide additional context about momentum and trend changes. Bollinger Bands focus on volatility behavior, while moving averages help identify broader price trends.
However, the value of these tools does not come from using the maximum number of indicators.
The important factor is whether the platform provides the right analytical capabilities for the user’s workflow.
A trader focusing on short-term market movements may require advanced chart customization and alerts.
Users who do not want to monitor charts continuously can also use crypto price alerts to track when selected assets cross predefined price levels.
A researcher comparing broader market behavior may prioritize historical data, multiple asset tracking, and flexible analysis views.
This difference explains why technical analysis platforms should be evaluated based on purpose rather than feature quantity.
Comparing Different Types of Cryptocurrency Analysis Platforms
Technical analysis tools are not identical, and different platform categories support different research workflows.
| Tool Category | Primary Purpose | Best Fit User | Main Limitation |
|---|---|---|---|
| Charting Platforms | Analyze price movement, indicators, and technical patterns | Traders and technical analysts | Primarily focused on chart-based market information |
| Crypto Analytics Platforms | Analyze broader market datasets and research metrics | Research-focused users | May not provide advanced chart workflows |
| Multi-Exchange Platforms | Monitor multiple exchanges from one interface | Users tracking several markets | Available features depend on exchange support |
This distinction helps users understand that cryptocurrency research platforms are not interchangeable.
The correct choice depends on the analytical question being answered.
A user studying short-term Bitcoin price patterns may need different capabilities than someone evaluating broader cryptocurrency market behavior.
Technical analysis platforms simplify this process by bringing relevant market information into one environment, allowing users to compare assets, monitor indicators, and develop repeatable analysis workflows.
Technical Analysis Tools Are Not the Same as Crypto Analytics Platforms
One common mistake is treating every cryptocurrency research platform as the same type of tool.
Although technical analysis tools and crypto analytics platforms may support similar research goals, they focus on different information sources.
Technical analysis tools primarily focus on:
- Price movement
- Trading volume
- Chart patterns
- Technical indicators
- Momentum analysis
Crypto analytics platforms often include additional datasets such as blockchain analysis, exchange flows, wallet behavior, and broader market metrics that can provide context beyond price charts.
The difference matters because the right tool depends on the user’s research objective.
For example, two users may analyze the same cryptocurrency market but require different platforms.
One user may focus on short-term chart patterns and need customizable charts, technical indicators, and alerts.
Another user may focus on broader market research and require additional analytical context beyond price movement.
Both users are analyzing cryptocurrency markets, but their workflows require different tools.
Neither approach replaces the other.
They support different types of market analysis.
Why Choosing the Right Tool Requires a Workflow-Based Approach
Many comparisons of cryptocurrency technical analysis tools focus mainly on popularity, pricing, or the number of available features.
However, these factors alone do not determine whether a platform is suitable for a specific user.
A stronger evaluation approach starts by understanding the workflow behind the analysis.
Before selecting a tool, users should consider:
- What type of analysis are they performing?
- Which market data is necessary for their process?
- Which features support their workflow?
- What limitations should they understand?
For example, imagine two users analyzing the same Bitcoin market data.
The first user studies short-term price patterns and needs customizable charts, indicators, and alerts.
The second user evaluates broader market conditions and needs additional research context beyond price charts.
Although both users analyze the same market, they may choose different platforms because their goals, required features, and analytical workflows are different.
This is why evaluating technical analysis tools should focus on workflow fit rather than simply identifying the platform with the longest feature list.
The following sections compare leading cryptocurrency technical analysis platforms and examine how different tools support different users, analysis goals, and market research workflows.
Best Technical Analysis Tools for Cryptocurrency Compared
Choosing a cryptocurrency technical analysis platform depends on more than the number of indicators or features available. Different platforms are designed for different research workflows, and the right choice depends on the type of analysis a user wants to perform.
Some users need advanced charting environments with customizable indicators and layouts. Others may prioritize simple market tracking, historical data, or broader research capabilities.
For this reason, comparing technical analysis tools requires evaluating how each platform supports specific analytical needs rather than identifying one universal winner.
Comparing Leading Cryptocurrency Technical Analysis Platforms
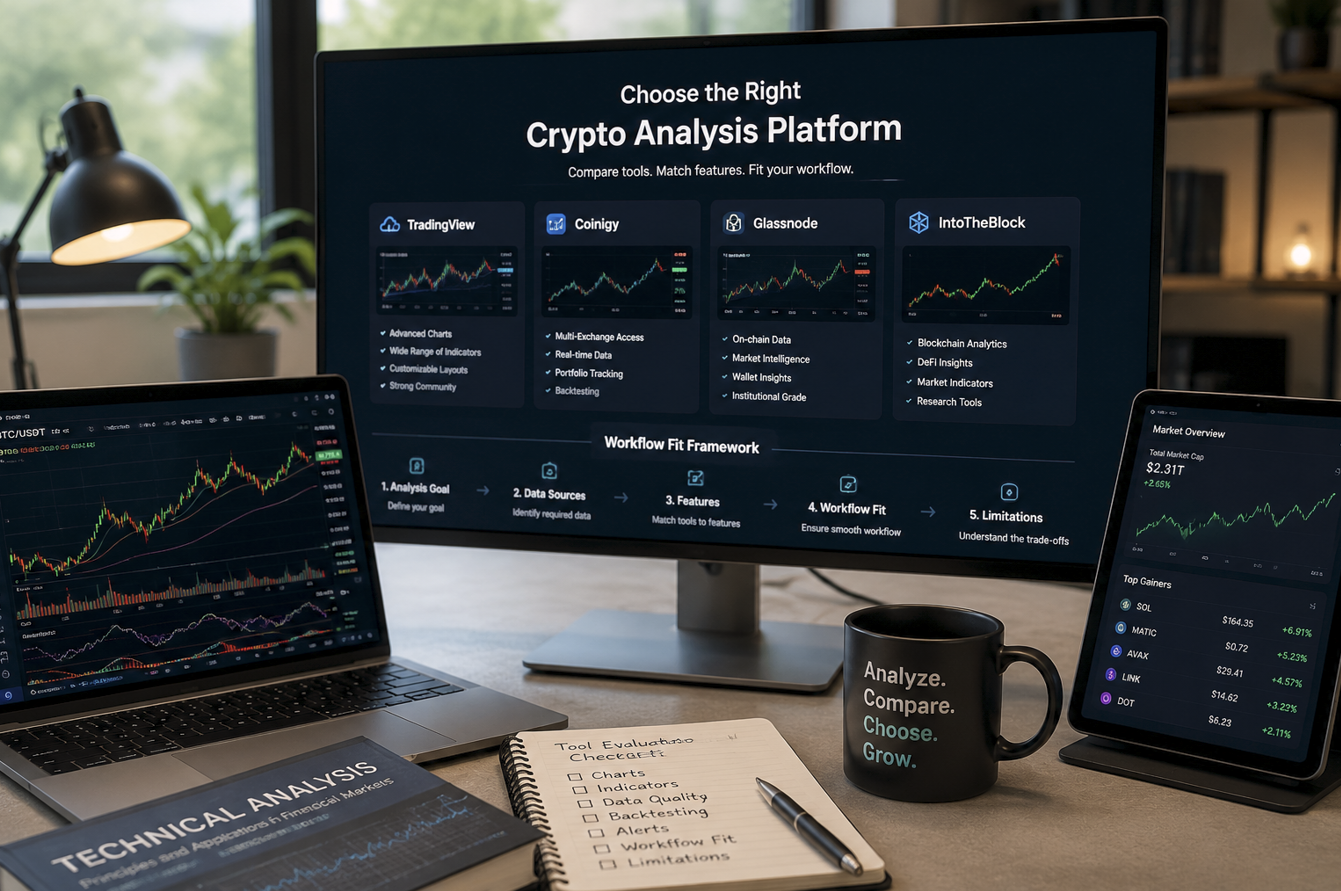
Several platforms are commonly used by traders, investors, and researchers to analyze cryptocurrency markets. Each platform provides different capabilities depending on the user’s workflow.
| Platform | Primary Strength | Best Fit User | Main Limitation |
|---|---|---|---|
| TradingView | Advanced charts, indicators, and customizable layouts | Active traders and technical analysts | Primarily focused on chart-based analysis |
| CoinMarketCap | Market data, rankings, and basic charts | Beginners and users tracking market information | Limited advanced technical workflows |
| CoinGecko | Price tracking, watchlists, and market overview | Casual investors and market researchers | Less focused on advanced chart analysis |
| Coinigy | Multi-exchange charting and portfolio monitoring | Users managing multiple exchanges | Feature availability depends on supported exchanges |
| CryptoQuant | On-chain and exchange data insights | Advanced market researchers | Requires more analytical experience |
| Glassnode | Long-term market intelligence and blockchain metrics | Research-focused investors | Less focused on traditional chart workflows |
This comparison shows why cryptocurrency technical analysis platforms serve different purposes.
A trader who studies short-term price movement may value chart customization, indicators, and alerts.
A researcher analyzing broader market conditions may require additional data sources beyond traditional price charts.
The appropriate platform depends on the user’s workflow and the information required to support analysis.
TradingView: Advanced Charting and Technical Analysis Workflows
TradingView is widely recognized for its charting capabilities and flexible technical analysis environment.
The platform provides access to customizable charts, technical indicators, drawing tools, alerts, and multiple timeframe analysis.
For users who rely heavily on price action, trend identification, and indicator-based analysis, TradingView provides a structured environment for building repeatable chart workflows.
A technical analyst may use the platform to compare assets, apply indicators such as RSI or MACD, create alerts, and organize different market views.
However, charting-focused platforms also have limitations.
Technical analysis tools primarily interpret available market information. They do not remove uncertainty or guarantee future market outcomes.
This makes workflow evaluation important.
A platform with extensive chart features may not be the right choice if a user’s research process depends more on broader market data or blockchain analytics.
CoinMarketCap and CoinGecko: Market Tracking and Research Basics
For users who need straightforward cryptocurrency market information, platforms such as CoinMarketCap and CoinGecko provide accessible ways to monitor prices, rankings, historical data, and watchlists.
These platforms are often suitable for beginners or investors who want a simple overview of market conditions before performing deeper analysis.
Their strength comes from accessibility and broad market coverage.
However, users requiring advanced chart layouts, complex indicators, or detailed technical workflows may need more specialized platforms.
This highlights an important evaluation principle:
A tool should match the complexity of the analysis being performed.
A simpler platform can be effective when it provides the necessary information without unnecessary complexity.
CryptoQuant and Glassnode: Beyond Traditional Chart Analysis
Some users require more than price charts and technical indicators.
Platforms such as CryptoQuant and Glassnode focus on broader market intelligence, including blockchain-related metrics, exchange activity, and additional datasets.
These platforms support research workflows that examine market behavior from different perspectives.
For example, an investor may combine traditional chart analysis with broader market data to understand additional factors affecting cryptocurrency markets.
However, these platforms serve a different purpose from traditional charting tools.
They expand the research process rather than replacing technical analysis platforms.
Choosing a Platform Based on Your Analysis Workflow
The most suitable cryptocurrency technical analysis tool depends on the user’s objectives.
| User Type | Primary Need | Suitable Platform Characteristics |
|---|---|---|
| Beginner | Understanding market movement | Simple charts, watchlists, accessible data |
| Active Trader | Short-term analysis | Advanced charts, indicators, alerts |
| Research-Focused Investor | Broader market understanding | Historical data, market intelligence, additional metrics |
| Multi-Exchange User | Monitoring different markets | Exchange integration and centralized workflow |
The goal is not to find a platform with the largest number of features.
The goal is to select a tool that supports the way you analyze cryptocurrency markets.
A strong evaluation process considers:
- What information is required?
- Which features support the analysis workflow?
- What limitations does the platform have?
- Does the tool match the user’s research objectives?
By evaluating cryptocurrency technical analysis platforms through workflow fit rather than popularity alone, users can create a more structured approach to market research.
The next section examines the key features users should evaluate before choosing a technical analysis platform, including chart quality, indicators, alerts, and data capabilities.
Key Features to Evaluate Before Choosing a Cryptocurrency Technical Analysis Tool
Choosing a cryptocurrency technical analysis platform requires more than comparing the number of indicators, available charts, or platform popularity.
A stronger evaluation process focuses on whether a tool provides the right combination of market data, technical capabilities, workflow support, and realistic limitations for the user’s analysis process.
Different users analyze cryptocurrency markets in different ways.
A beginner may need a simple environment that helps them understand price movement and basic indicators. An active trader may require advanced chart layouts, technical indicators, and real-time alerts. A research-focused investor may prioritize historical information, broader market context, and additional analytical datasets.
Because these workflows are different, the most suitable technical analysis platform depends on the relationship between the user’s analysis goals and the capabilities provided by the tool.
The objective is not to find the platform with the largest feature list.
The objective is to identify the platform that best supports the way a user collects information, evaluates market conditions, and organizes their research process.
Evaluating Chart Quality and Market Visualization
Chart quality is one of the first factors users should evaluate when comparing cryptocurrency technical analysis tools.
A strong charting environment helps users understand price movement, compare different timeframes, and apply technical concepts without unnecessary complexity.
The most valuable charting features are not simply the number of available tools, but how effectively they support the user’s workflow.
For example, an active trader may need customizable layouts, multiple timeframe analysis, and quick access to indicators. A long-term investor may focus more on historical price behavior and broader market visibility.
A suitable charting platform should make important information easier to interpret rather than create additional complexity.
Evaluating Technical Indicators and Analytical Flexibility
Technical indicators are an important part of cryptocurrency market analysis, but their value depends on how they are used within a broader research process.
Common indicators include Relative Strength Index (RSI), Moving Average Convergence Divergence (MACD), moving averages, Bollinger Bands, and Fibonacci retracement levels.
These tools can help users evaluate:
- Momentum changes
- Trend direction
- Volatility conditions
- Potential market patterns
Broader research workflows may also incorporate crypto market news and context when users need to understand developments that price charts alone may not explain.
However, selecting a platform only because it offers a large number of indicators can lead to poor workflow decisions.
A stronger approach evaluates whether the platform provides the specific analytical capabilities required for the user’s process.
For example, a trader may combine price action, volume analysis, and momentum indicators to evaluate market conditions. Another user may need fewer indicators but stronger historical data and research capabilities.
The important question is not:
“How many indicators does this platform provide?”
The better question is:
“Does this platform provide the analytical tools required for my market research workflow?”
Evaluating Real-Time Data, Alerts, and Monitoring Capabilities
Cryptocurrency markets operate continuously, which makes data availability and monitoring features important considerations.
Many technical analysis platforms provide features such as real-time price updates, watchlists, alerts, and multi-asset monitoring.
These capabilities help users organize market information and reduce the need to manually track every asset.
For example, a user monitoring several cryptocurrencies may benefit from alerts that highlight specific market conditions or price movements.
However, alerts should be viewed as workflow support rather than automatic decision systems.
A notification can identify a condition that requires attention, but users still need to evaluate market context, data quality, and platform limitations before interpreting the information.
Technical analysis tools support analysis; they do not eliminate uncertainty from cryptocurrency markets.
Evaluating Data Sources and Platform Capabilities
One of the most important parts of choosing a cryptocurrency technical analysis tool is understanding what type of information the platform provides.
Different platforms focus on different types of market data.
Some platforms are primarily designed around:
- Price charts
- Trading volume
- Technical indicators
Other platforms expand into broader market research through:
- Blockchain metrics
- Exchange activity
- Historical datasets
- Market intelligence
The right choice depends on the analytical question being answered.
A trader focused on chart patterns may require advanced technical features.
A research-focused investor may need broader datasets to understand market behavior beyond price movement.
This is why comparing platforms only by feature count does not provide a complete evaluation.
A stronger selection process connects:
Analysis Goal → Required Data → Platform Capability → Workflow Fit
Understanding Platform Limitations Before Choosing a Tool
Every cryptocurrency technical analysis platform has strengths and limitations.
A chart-focused platform may provide excellent technical analysis features but offer limited broader market research.
A data-focused platform may provide deeper market insights but require more experience to interpret effectively.
A beginner-friendly platform may simplify market monitoring but lack advanced customization.
Understanding these differences prevents users from selecting tools based only on popularity or marketing claims.
A reliable evaluation process considers both what a platform provides and what it does not provide.
| Evaluation Area | Question Users Should Ask | Why It Matters |
|---|---|---|
| Charting | Does the platform support my analysis style? | Ensures charts match workflow needs |
| Indicators | Are the required technical tools available? | Helps evaluate analytical flexibility |
| Data Sources | Does the platform provide the information I need? | Prevents choosing unsuitable tools |
| Workflow Fit | Does the platform support my research process? | Improves consistency and efficiency |
| Limitations | What does this platform not provide? | Creates realistic expectations |
Choosing a Platform Through the Crypto Technical Analysis Workflow Fit Framework
The strongest way to evaluate cryptocurrency technical analysis tools is to match platform capabilities with the user’s actual workflow.
Different users require different combinations of features, data, and research environments.
| Analysis Goal | Required Capability | Platform Type |
|---|---|---|
| Beginner Research | Simple charts, basic indicators, accessible market data | Basic Charting Platform |
| Active Trading | Advanced charts, indicators, alerts, multiple timeframe analysis | Advanced Charting Platform |
| Market Research | Historical data, broader metrics, additional market intelligence | Analytics Platform |
| Multi-Exchange Monitoring | Exchange connectivity and centralized tracking | Multi-Exchange Platform |
This workflow-based approach helps users evaluate platforms based on their actual needs rather than popularity alone.
Before choosing a technical analysis tool, users should ask:
- What type of market analysis am I performing?
- Which data sources are important for my research?
- Which technical features support my process?
- What limitations should I understand before relying on this platform?
Final Method: Evaluating Technical Analysis Tools Through Workflow Fit
Cryptocurrency technical analysis tools can improve how users organize market information, analyze historical behavior, and build structured research workflows.
However, the effectiveness of a platform depends on how well it matches the user’s analytical requirements.
The Forvest Crypto Technical Analysis Workflow Fit Method provides a structured way to evaluate these platforms:
1. Define the Analysis Goal
Understand what type of market research you are performing.
2. Identify Required Data Sources
Determine whether you need price data, indicators, broader analytics, or additional market information.
3. Match Technical Features
Evaluate whether the platform provides the tools required for your process.
4. Evaluate Workflow Fit
Consider whether the platform supports the way you analyze markets.
5. Understand Platform Limitations
Recognize what the tool can and cannot provide.
Using this method helps users move beyond simple platform comparisons and make more structured decisions based on their own research workflow.
The goal is not to find one universal “best” cryptocurrency technical analysis tool.
The goal is to identify the platform that provides the right combination of data, features, workflow support, and realistic expectations for the way you analyze cryptocurrency markets.
Disclaimer
This article is provided for educational and informational purposes only and does not constitute financial advice, investment advice, or a recommendation to use any specific cryptocurrency platform, tool, or strategy.
Cryptocurrency markets involve significant uncertainty and risk. Technical analysis tools can help users organize market information and evaluate historical patterns, but they cannot guarantee future price movements, remove market uncertainty, or ensure trading outcomes.
Users should conduct their own research and consider their individual circumstances before making any financial decisions.
Seven Criteria for Comparing Technical-Analysis Platforms
- Data provenance: exchanges, aggregation rules, outages and historical depth.
- Workflow fit: manual charts, screening, alerts, scripting or portfolio review.
- Reproducibility: saved settings, exports and versioned scripts.
- Cost realism: plan limits, data fees and execution integrations.
- Security: whether the tool needs read-only or trading API permissions.
- Validation: ability to test fees, slippage and unseen periods.
- Exit path: exportability if the product changes or closes.
Free vs Paid: What a Beginner Actually Needs
A free chart with reliable candles, a few indicators, drawing tools and alerts is often enough to learn. Pay only when a specific limitation blocks a documented workflow—for example more alerts, longer history, scripting or export. Premium access does not create a profitable strategy.
Build a Minimal Tool Stack
- One charting/data source
- One place to test and document rules
- One portfolio and risk view
- Optional derivatives or on-chain source only when the strategy uses it
Learn the method in how to use crypto indicators, then document it with the strategy framework. For broader research categories, see crypto research tools by question.
Related reading: Use these related guides to apply the framework: recommended candlestick-analysis books.