


Technical analysis in crypto is often taught like a trader’s toolkit: dozens of indicators, short timeframes, and “signals” that promise certainty. However, long-term crypto investors need a different style of chart reading. Instead of predicting the next candle, you want a repeatable process that helps you avoid unstable structure, control downside, and act consistently when volatility rises.
That’s the investor-safe definition of crypto technical analysis: a way to translate price behavior into risk-aware decisions, without relying on hype or overconfident forecasting.
This guide follows a five-step workflow: read market structure, mark support and resistance zones, confirm with volume, adjust for volatility, and apply risk rules. Use the same order each week so your chart analysis remains consistent and auditable.
If you want a higher-level decision framework that combines context, participation, and risk before you look at charts, this market analysis guide shows how to use a five-factor crypto market analysis checklist.
Need a charting platform? This article teaches the reading method. For platform selection, compare the best crypto technical analysis tools by workflow, chart quality, indicators, alerts, and data coverage.
What Crypto Technical Analysis Means for Investors (Not Traders)
For investors, technical analysis should answer three questions:
-
Where is the market structurally healthy vs fragile?
-
Which zones define risk (so you don’t buy into noise)?
-
What is the simplest confirmation that a move is real (or likely a trap)?
It should not do this:
-
Turn into “prediction content” or “buy/sell calls”
-
Stack indicators until the chart becomes unreadable
-
Pretend that one pattern works in all regimes
Crypto’s biggest problem is regime change. The same setup can work in a strong trend and fail repeatedly in a choppy range. Because of that, your process must start with structure, then layers—never the other way around.
1. Start With Market Structure
Read Market Structure Before Indicators
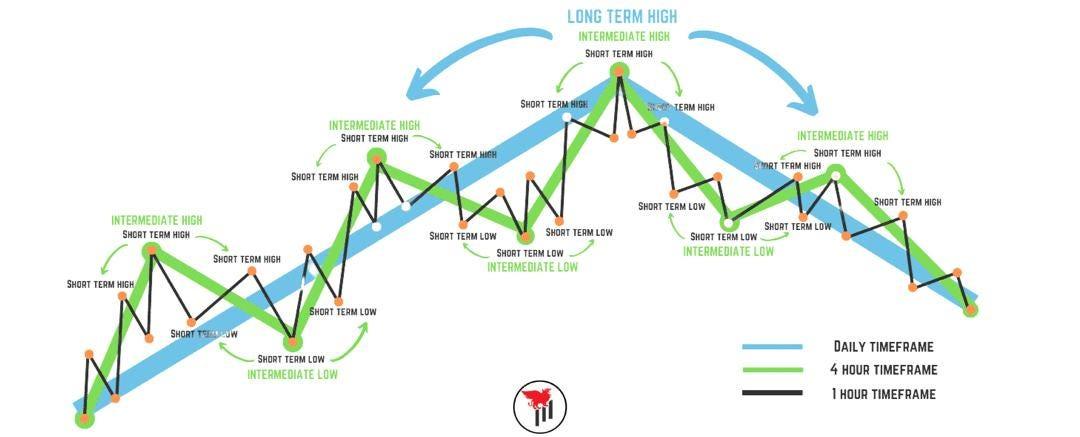
Market structure is the simplest, highest-signal layer in technical analysis. It describes how price is behaving over time:
-
Uptrend: higher highs + higher lows
-
Downtrend: lower lows + lower highs
-
Range: price oscillates inside a band
-
Transition: trend weakens and volatility often increases
Instead of reacting to every move, an investor-safe approach classifies the “game” first. That classification helps you avoid a common trap: using trend tools during ranges (or buying breakouts when the market is still range-bound).
Investor note: structure is not about being right today. It’s about avoiding the wrong risk tomorrow.
Treat Support and Resistance as Zones
Support and resistance in crypto works better as zones, not exact prices. Liquidity doesn’t sit on one perfect number. It clusters in areas where:
-
price repeatedly rejected
-
high volume previously traded
-
prior swing highs/lows formed
-
volatility expanded (often leaving a “decision zone”)
If you draw razor-thin lines, you’ll get faked out constantly. Zones make your process more realistic, and they fit investor execution (staged entries, rebalancing, and risk caps).
How to mark zones quickly (investor-safe):
-
Start from higher timeframe (daily/weekly)
-
Mark prior swing points (major pivots only)
-
Expand into a zone that covers the “decision area”
-
Keep the number of zones small (clarity beats clutter)
2. Use the Structure → Zones → Risk Workflow
Use this sequence to keep charts readable and decisions consistent:
-
Pick the timeframe that matches your horizon (daily/weekly for most investors)
-
Classify structure (trend / range / transition)
-
Mark zones (2–6 major support/resistance areas)
-
Define risk (what would invalidate your view?)
-
Only then consider confirmation tools (volume, volatility regime)
This structure-first method is how strong financial content stays credible: it’s explainable, repeatable, and less sensitive to short-term noise.
Market Structure Decision Map
| Structure type | What you see on the chart | Investor meaning | Common mistake to avoid |
|---|---|---|---|
| Uptrend | Higher highs + higher lows | Hold/scale with discipline; focus on risk zones | Chasing tops after extended moves |
| Downtrend | Lower lows + lower highs | Treat rallies as fragile until structure improves | “Catching the bottom” without confirmation |
| Range | Repeated bounces inside a band | Prioritize zones; expect fakeouts | Trading breakouts too early |
| Transition | Trend weakens; wider swings | Reduce size; wait for clarity | Adding exposure during instability |
| High-noise microstructure | Whipsaws, irregular spikes | Zoom out; filter noise | Overtrading short timeframes |
Rules That Keep Chart Analysis Investor-Safe
These rules are simple, but they protect you from most “chart-content” traps:
-
Zoom out first. Higher timeframes reduce noise and reveal real structure.
-
Use fewer tools. If you need 10 indicators, the setup is weak.
-
Confirm with behavior, not slogans. A breakout is not real because someone says so.
-
Write down invalidation. If you can’t define where you’re wrong, you’re guessing.
-
Prefer staged decisions. Investors rarely need all-in entries.
How to Draw Zones Without Overfitting
| Zone type | How to identify it | Why it matters in crypto | Investor-safe action |
|---|---|---|---|
| Prior swing high zone | Old top area where price rejected | Often turns into resistance or breakout test | Avoid chasing into it; wait for acceptance |
| Prior swing low zone | Old bottom area with repeated bounces | Often becomes the “risk boundary” | Use it to define invalidation and sizing |
| High-volume area | Where price spent time consolidating | Liquidity clusters; reactions are common | Use as “decision zone,” not exact line |
| Breakdown/reclaim zone | Sharp drop area followed by retest | Fakeouts happen frequently in crypto | Wait for confirmation before adding |
| Volatility expansion zone | Big candle region with wide range | Signals stress; levels become messy | Reduce size; demand stronger confirmation |
Quality Standards for Reliable Chart Analysis
Stronger pages usually:
-
Start with structure and timeframes
-
Explain support/resistance as zones
-
Use simple visuals and clear definitions
-
Separate “context” from “action”
-
Avoid claiming certainty
Weaker pages often:
-
Jump straight into indicators and patterns
-
Mix timeframes without saying so
-
Use hype terms (“guaranteed breakout”)
-
Ignore regime changes
-
Hide risk and failure cases
Structure and Zone Checklist
At this point, you have the base layer of crypto technical analysis that investors can actually use:
-
Market structure tells you whether conditions are trending, ranging, or unstable.
-
Support and resistance zones translate price history into practical risk boundaries.
-
A clean workflow prevents overfitting and keeps decisions consistent.
Next (Part 2): we’ll add the two confirmation layers that matter most for investor-grade crypto charts: volume confirmation (to judge participation) and volatility regime (to understand risk conditions before sizing exposure).
3. Confirm With Volume and Volatility
If Part 1 built the base (market structure + support and resistance zones), Part 2 adds the two confirmation layers that matter most for crypto investors: volume confirmation and volatility regime. These are the tools that help you answer a practical question:
“Is this move real participation, or just a low-liquidity swing that can reverse fast?”
Done correctly, volume and volatility don’t become “signals.” Instead, they become filters that reduce false breakouts, prevent emotional entries, and keep sizing rational during stressed markets.
What Volume Can and Cannot Confirm
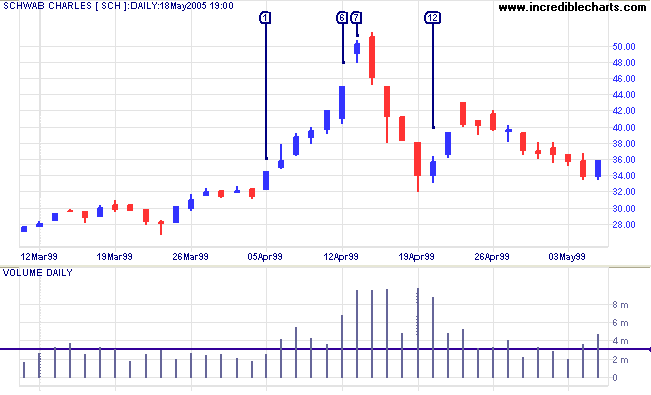
In crypto technical analysis, volume is often treated like a magic truth machine: “volume is high, therefore price must continue.” That’s not investor-safe. Volume is better used as a credibility check:
-
High volume on a move suggests broad participation.
-
Low volume on a move suggests fragility (easier to fade).
-
Rising volume during continuation often supports trend health.
-
Spiking volume at extremes can mean capitulation (not always a bottom, but often a stress marker).
However, volume in crypto has important caveats:
-
Spot vs derivatives volume can tell different stories.
-
Exchange data varies by venue and reporting quality.
-
In smaller assets, volume is easier to manipulate.
So the investor approach is: use volume to confirm structure, not to override it.
Volume Questions Worth Asking
When reading charts, focus on a small set of repeatable questions:
-
Breakout credibility: Did the breakout above resistance happen with noticeably stronger participation than the prior range?
-
Pullback quality: Did volume contract during the pullback (healthier) or expand (more risk)?
-
Trend health: Are rallies supported by consistent volume, or do they look thin and easily reversed?
-
Distribution clues: Does volume rise when price fails at resistance (possible distribution)?
-
Panic behavior: During sharp drops, is there a one-time spike (panic flush) or repeated heavy volume (persistent selling pressure)?
This is how stronger “bitcoin technical analysis” pages stay credible: they describe market behavior, not predictions.
Volume Patterns for Long-Term Investors
| Chart situation | What volume often shows | What it usually means | Investor-safe response |
|---|---|---|---|
| Breakout above resistance zone | Volume expansion vs range average | More credible acceptance | Wait for retest or daily close confirmation |
| Breakout on weak volume | Thin participation | Higher fakeout risk | Reduce size, demand more confirmation |
| Pullback in an uptrend | Volume contracts | Selling pressure is contained | Staged entries near support zones |
| Pullback with rising volume | Aggressive selling | Trend health questionable | Delay adds; tighten risk boundaries |
| Sideways range | Volume rotates | Indecision / balance | Trade less; focus on clean levels |
| Sharp selloff | Volume spike | Stress / liquidation-like behavior | Avoid impulsive entries; wait for structure to stabilize |
Common Volume Traps
To keep your analysis clean and SEO-stable, avoid claims that Google readers interpret as “signals”:
-
Trap: “High volume guarantees continuation.”
Fix: “Higher participation can support credibility, but structure still decides.” -
Trap: “Low volume means price will fall.”
Fix: “Low participation increases reversal risk, especially near resistance.” -
Trap: “Volume proves smart money is buying.”
Fix: “Volume shows activity intensity, not the identity of participants.”
This wording keeps the content investor-safe and avoids overpromising.
Why Volatility Regimes Matter More Than Extra Indicators
Volatility is the most practical risk metric for investors because it directly affects:
-
position sizing
-
entry pacing (staged vs aggressive)
-
stop distance (if you use stops)
-
emotional pressure (how noisy the tape is)
In a “volatility regime crypto” lens, you’re not trying to forecast direction. Instead, you’re classifying the environment:
-
Low volatility: calmer conditions, ranges or steady trends
-
Rising volatility: transition phases, higher fakeout risk
-
High volatility: stressed markets, liquidation cascades, headline sensitivity
-
Volatility compression: potential energy build-up (but breakouts can go either way)
The investor edge is simple: adjust exposure to the regime.
Volatility Regime Decision Map
| Volatility regime | What it looks like | Typical behavior | Investor-safe adjustment |
|---|---|---|---|
| Low / stable | Tight daily ranges, orderly trend | Cleaner levels, fewer wicks | More comfortable holding core exposure |
| Rising | Wider candles, more chop | False breakouts increase | Reduce size, widen patience, demand confirmation |
| High / stressed | Large wicks, fast reversals | News-driven spikes, cascade risk | Prioritize capital protection; avoid impulse |
| Compression | Narrow range, decreasing ATR-like behavior | “Spring” effect possible | Plan zones; wait for acceptance + volume confirmation |
| Shock event | One or two extreme candles | Liquidity gaps, slippage risk | Pause adds; reassess structure on higher timeframe |
Combine Structure, Zones, Volume, and Volatility
Here is a simple investor workflow that mirrors how serious crypto chart analysis is written:
-
Start with market structure crypto
Trend, range, or transition? -
Mark support and resistance zones
Keep it minimal and high timeframe. -
Check volume confirmation crypto
Does participation support the story? -
Label the volatility regime crypto
Is risk calm, rising, or stressed? -
Choose the “behavior plan”
Staged entry, rebalance, or monitor only.
Notice what’s missing: a prediction. That’s intentional. The goal is a defensible process.
Minimal Investor Chart Toolkit
-
Market structure (trend/range/transition)
-
Support and resistance zones
-
Volume confirmation (credibility filter)
-
Volatility regime (risk context)
-
One execution rule: staged entries + exposure caps
Anything beyond this should be added only if it improves decisions consistently.
Practical Non-Directional Examples
To keep your technical analysis content professional, use wording like:
-
“Price is testing a resistance zone with stronger participation than the prior range.”
-
“Volatility is elevated, so position sizing and pacing matter more than precision.”
-
“The market is transitioning; confirmation is more important than speed.”
-
“Volume contracted during the pullback, which can be consistent with controlled selling.”
This matches how strong finance sites communicate: observational, not promotional.
Volume and Volatility Checklist
By the end of Part 2, your crypto technical analysis stack is now investor-grade:
-
Volume confirmation helps you judge whether moves have real participation or are fragile.
-
Volatility regimes tell you how risky the environment is before you size exposure.
-
Together, they reduce fakeouts and keep decisions consistent under stress.
Next (Part 3): we’ll connect everything into a repeatable “technical analysis for crypto investors” checklist and show how to use indicators as second opinions (not decision engines), so the full cluster ends practical and publish-ready.
4. Apply the Repeatable Investor Workflow
To recap, Part 1 built the foundation (market structure + support and resistance zones), while Part 2 added confirmation layers (volume confirmation + volatility regime crypto). Now Part 3 turns everything into something you can repeat every week without drifting into trading language.
This is the key difference between “crypto technical analysis” content that ranks for a month and content that stays strong for years: it reads like a process, not a prediction thread.
What Technical Analysis Should Do for an Investor
Technical analysis for crypto investors should not be framed as “predict the next move.” Instead, it should help with three practical outcomes:
-
Reduce bad timing (avoid buying into unstable structure or panic candles)
-
Shape risk (define zones, sizing, invalidation)
-
Stay consistent (repeatable checks, not emotional reactions)
That’s why professional chart reading focuses on context → confirmation → risk rules, then stops.
The Three-Layer Chart Read
Use this order every time. It’s simple and works across BTC, ETH, and most liquid majors.
Technical structure can be combined with model-based evidence, but a model should be tested before its output is trusted. Use this guide to evaluate AI crypto prediction models for leakage, weak baselines, poor calibration, and regime failure.
Layer A — Market structure crypto (the environment)
Ask: are we trending, ranging, or transitioning?
-
Trend: higher highs/higher lows (or the opposite)
-
Range: repeated rejection between two zones
-
Transition: trend losing clarity, chop increases
Layer B — Support and resistance zones (where decisions live)
Mark only high-quality zones:
-
prior weekly/daily pivots
-
consolidation tops/bottoms
-
high-volume “decision areas” (if you can observe them)
Keep zones wide enough to handle noise. Crypto is not precise.
Layer C — Confirmation (volume + volatility regime)
Use confirmation only to judge credibility and risk, not direction.
-
volume confirmation crypto: participation vs thin moves
-
volatility regime: calm vs rising vs stressed
This structure is clean, defensible, and easy for readers to follow—so it tends to perform well for “technical analysis for crypto investors” queries.
Investor-Safe Technical Analysis Checklist
| Step | What to check | What you write (neutral) | What it prevents |
|---|---|---|---|
| 1 | Higher timeframe bias | “Weekly structure looks trending/ranging/transitioning.” | Overreacting to noise |
| 2 | Key zones | “Price is near a support/resistance zone defined by prior pivots.” | Precision traps |
| 3 | Level reaction | “Acceptance/rejection is visible via closes and wicks.” | Fakeout entries |
| 4 | Volume confirmation | “Participation expanded/contracted on the move.” | Chasing thin moves |
| 5 | Volatility regime | “Risk is calm/rising/stressed based on range behavior.” | Oversizing |
| 6 | Risk rule | “Invalidation is defined by structure break, not emotion.” | Improvised exits |
| 7 | Execution style | “Staged entries + exposure caps fit the regime.” | All-in decisions |
Use Indicators Without Becoming Indicator-Driven
Indicators are not the base layer. They are second opinions after structure and zones.
A minimal indicator set that aligns with investor-safe chart analysis:
-
Moving averages (MA): trend smoothing (not “signals”)
-
RSI: extreme conditions as context (not buy/sell triggers)
-
Bands (Bollinger-style logic): volatility expansion vs contraction
If you use indicators, use them with this rule:
If the chart structure and zones don’t make sense without the indicator, don’t trade the idea.
That keeps the workflow stable and avoids “indicator soup,” which is common in weak crypto technical analysis pages.
Investor-Safe Indicator Use vs Misuse
| Tool | Investor-safe use | Common misuse | Better phrasing |
|---|---|---|---|
| Moving averages | Confirm trend direction and smooth noise | “MA cross = guaranteed trend” | “MA slope supports the structural read.” |
| RSI | Identify extreme conditions / divergence as context | “RSI oversold = buy” | “RSI shows pressure; structure decides entries.” |
| Volatility bands | Regime labeling (expansion/compression) | “Touching band = reversal” | “Band expansion signals higher risk conditions.” |
| Multiple indicators | One confirmation max | Stacking 6+ tools | “Keep signals minimal and repeatable.” |
Execution Rules for Investors
Investors should assume the market can move against them even when the thesis is strong. Therefore, the execution layer should be designed to reduce regret, not to “win the entry.”
Investor-safe execution patterns:
-
Staged entry into zones (not at one price)
-
Exposure caps that tighten when volatility rises
-
Rebalancing rules when allocations drift
-
Invalidation conditions defined by structure, not feelings
A simple approach that readers understand quickly:
-
If volatility is rising, slow down and size down.
-
If volatility is stressed, prioritize protection and clarity.
-
If volatility is calm, you can hold core exposure more comfortably.
This fits “crypto chart analysis” search intent while staying non-directional.
Common Crypto Technical Analysis Mistakes and Fixes
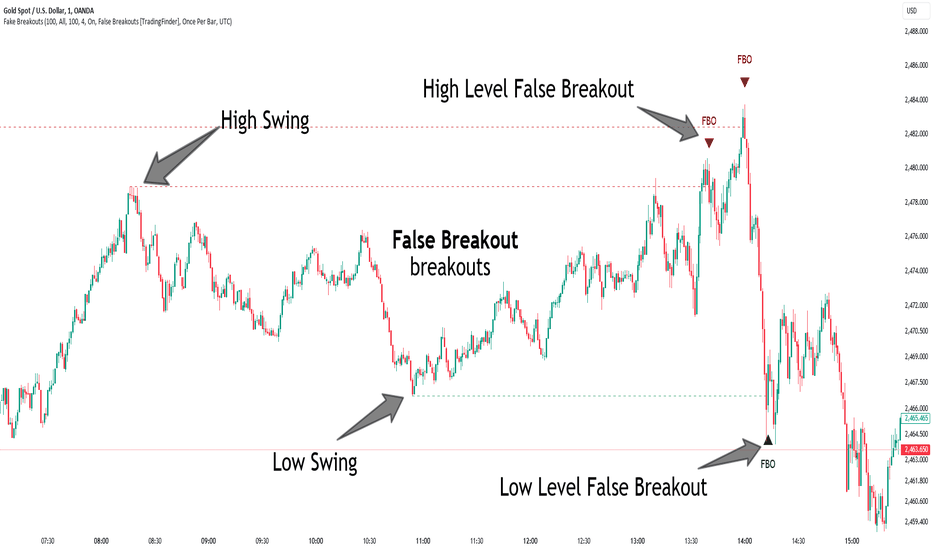
1) Turning support/resistance into a single line
Instead of one precise price, treat the area as a zone. In crypto, wicks and fakeouts are normal—so the zone matters more than the exact number.
2) Skipping market structure (trend vs range vs transition)
Before any indicator, classify the environment first. A clean trend, a sideways range, and a transition phase behave differently—so your interpretation must change with them.
3) Treating volume as a guarantee
Volume works best as a credibility filter, not a promise. Strong participation can support a move; however, it never removes uncertainty.
4) Oversizing during a stressed volatility regime
When volatility is elevated, pacing and exposure should tighten. As a result, sizing rules matter more than “finding the perfect entry.”
5) Copy-pasting indicator settings across all assets and regimes
Indicators need restraint. Keep them minimal and interpret them as context, because settings that look great in one regime can mislead in another.
6) Entering without an invalidation rule
Every chart idea needs a defined “what would change my mind?” point. Without it, exits become emotional and inconsistent.
7) Letting one timeframe dominate the entire decision
Use higher timeframes for structure and key zones, then use lower timeframes for execution detail. That sequencing reduces noise-driven decisions.
How to Document a Chart Decision Clearly
When you write weekly or evergreen sections, use this repeatable paragraph structure:
-
Context: “Structure is trending/ranging/transitioning.”
-
Zones: “Price is near a support/resistance zone.”
-
Confirmation: “Volume/volatility supports or warns about fragility.”
-
Risk: “Sizing and pacing should match the regime.”
It reads professional, avoids prediction language, and keeps the piece consistent.
Continue the workflow: Use crypto technical indicators as secondary evidence, then apply a crypto risk management framework before turning a chart view into an allocation decision.
Final Investor-Safe Technical Analysis Workflow
This Technical Analysis cluster is designed to be repeatable, neutral, and useful for crypto investors:
-
Market structure crypto tells you what environment you’re in.
-
Support and resistance zones tell you where decisions matter.
-
Volume confirmation crypto tells you whether moves look credible or fragile.
-
Volatility regime crypto tells you how much risk you’re dealing with.
-
Execution rules (staged entries, exposure caps, rebalancing, invalidation) turn analysis into a disciplined process.
If you apply the workflow in the same order each time, your chart reading becomes less emotional, more auditable, and more consistent—which is exactly what investor-grade technical analysis should do.
Related reading: For the next step, continue with candlestick-analysis books for deeper study and price, volume and pattern alert types.