
- TL;DR (Key Takeaways)
- Why Investors Need More Than One Test
- Historical Backtests — Fast, Informative, but Limited
- Walk-Forward Testing — Rolling Out-of-Sample Durability
- Historical vs Walk-Forward — When to Use Each
- Practical Example (Setup Only—We’ll Evaluate in Part 2)
- Common Pitfalls in These Two Layers (and Quick Fixes)
- Pulling It Together (End of Part 1)
- Live / Paper Testing — Turning Designs into Real Execution
- Evaluation of Two Portfolio Models (A vs B)
- Live / Paper Rollout Plan (From Trial to Deployment)
- Common Pitfalls in Live/Paper (and Quick Fixes)
- Putting It All Together — A Clean Investor Sequence
- Conclusion
- Related Forvest Tools in Our AI Assistant, Fortuna
Investment backtests come in three layers: historical (fast idea validation), walk-forward (rolling out-of-sample durability), and live/paper (current-regime reality). Use historical to design, walk-forward to avoid overfitting, and live tests to confirm execution under fees, slippage, and delays—before allocating real capital.
TL;DR (Key Takeaways)
-
Historical = quick idea screening across past regimes; walk-forward = durability across rolling windows; live/paper = proof in today’s market.
-
Don’t skip costs, slippage, liquidity, and regime effects.
-
Best sequence: Historical → Walk-Forward → Live/Paper → Scale prudently.
-
Keep rules simple, explainable, and parameter-stable; you want robustness, not record highs.
Why Investors Need More Than One Test
No single test answers every question. Historical backtests answer “Would this have worked before?” Walk-forward asks “Does the logic persist when the window shifts?”—and live/paper asks “Does it still work now with real execution?”
Relying on only one layer creates blind spots:
-
A pure historical win can be overfit to a unique past regime.
-
A pure walk-forward win without a good live trial can miss execution frictions (spreads, delays).
-
A pure live test without prior filtering is slow, expensive in time, and vulnerable to false positives from short samples.
The investor’s edge isn’t guessing the future—it’s building a repeatable process. Multiple, complementary tests reduce both model risk (bad assumptions) and operational risk (bad execution).
 Related: Want to start from the basics? See Crypto Portfolio Backtesting — The Complete Guide
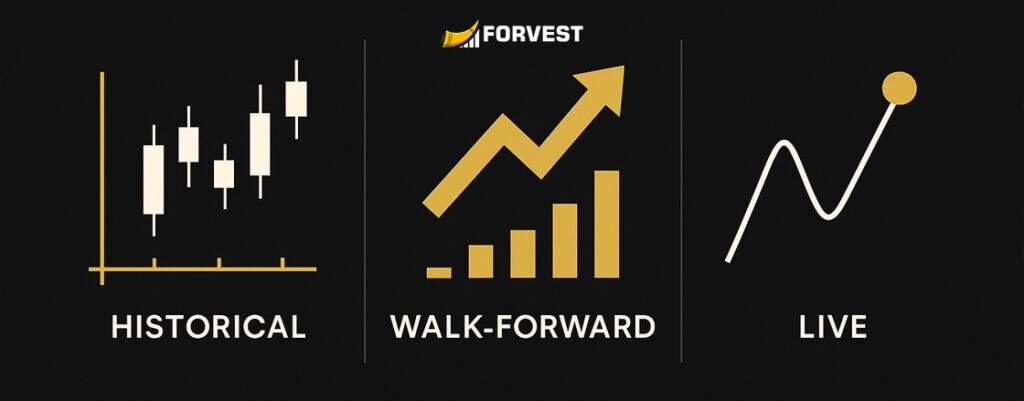
A visual snapshot of how different backtesting methods evolve from past data to real-time validation.
Historical Backtests — Fast, Informative, but Limited
What it is
You codify a portfolio policy (universe, allocation, rebalancing cadence, optional regime filters) and simulate it on historical data. The outcome shows how capital would have behaved across bull, bear, and sideways phases.
Why investors love it
-
Speed: You can iterate ideas, compare variants, and find sanity-checked directions quickly.
-
Coverage: Multi-year spans show behavior across different market moods.
-
Education: Seeing CAGR, Max Drawdown, Sharpe/Calmar, worst month/year, time-under-water turns abstract risk into something tangible.
Where it fails (if you’re not careful)
-
Regime mismatch: A design that shines in one phase (e.g., 2020–21 bull) might stumble in a different environment.
-
Overfitting: Micro-tuned parameters (EMA 47 vs 48) can create fragile edges that vanish out-of-sample.
-
Friction blindness: Ignoring fees, slippage, spreads, and liquidity produces fantasy equity curves.
Investor checklist for realistic backtests
-
Data quality: Use credible sources; clean anomalies (re-denominations, stale ticks, delistings).
-
Coverage: Aim for 3–5 years minimum so multiple regimes appear.
-
Universe integrity: Avoid survivorship bias—assets should enter/exit when they actually existed.
-
Friction modeling: Include fees, slippage, and spreads; then stress them higher to test fragility.
-
Liquidity filters: Exclude assets below sensible volume/market-cap thresholds.
-
Simple, explainable rules: Favor few parameters with stable ranges over hyper-tuned values.
-
Evaluation panel: Always log CAGR, Max DD, Sharpe/Calmar, worst periods, time under water, and per-year results.
Use historical backtests to find viable directions—not to crown a “perfect” strategy.
Walk-Forward Testing — Rolling Out-of-Sample Durability
What it is
Walk-forward turns static backtests into a moving reality check. You split history into sequential windows (e.g., 12–18 months). In each step:
-
Pick modest parameter ranges using the first sub-window.
-
Lock them.
-
Test on the next sub-window (which the model hasn’t “seen”).
-
Roll the window and chain results into one equity curve.
What it proves
-
Durability: Can the logic carry into a new, unseen period?
-
Regime tolerance: Do results hold when the market flips from bullish to choppy or bearish?
-
Parameter stability: Do ranges (not single magic numbers) still produce acceptable outcomes?
Best-practice guardrails
-
Window design: Too short = noise; too long = overfit to an era. Most investor policies work well with 12–18-month blocks.
-
Bounded tuning: Don’t chase a razor-thin optimum; seek plateaus of acceptable performance.
-
Full-panel evaluation: Review rolling Sharpe/Calmar, Max DD, cumulative growth, and time under water per window.
-
Friction discipline: Keep the same fees/slippage profile as in historical; if walk-forward collapses under friction, the idea wasn’t robust.
Investor takeaway
If walk-forward breaks a design that looked amazing historically, you didn’t find an edge—you found a curve-fit. That’s a win: you avoided taking a fragile system live.
Historical vs Walk-Forward — When to Use Each
Use Historical when you need to:
-
Explore universe choices (e.g., BTC/ETH/SOL + stables) and base allocations (equal-weight, risk-based).
-
Compare rebalancing cadences (monthly, quarterly, or conditional) and simple regime filters.
-
Surface big-picture risk characteristics (Max DD ceiling, worst month/year).
Use Walk-Forward when you need to:
-
Validate that performance holds out-of-sample—not just in one continuous backtest.
-
Check parameter-range stability and filter out designs that win only with narrow knobs.
-
Confirm regime tolerance before any live/paper deployment.
Sequence that works
Historical narrows the field to 1–2 explainable policies → walk-forward vets their durability → then (in Part 2) you prove execution reality with live/paper.
Related: Learn the practical differences in our guide to backtesting vs forward testing
Practical Example (Setup Only—We’ll Evaluate in Part 2)
Let’s draft two simple, investor-friendly policies we’ll later walk-forward and compare:
Model A — Equal-Weight + Regime Filter
-
Universe: BTC, ETH, SOL (+ optional stables).
-
Allocation: equal weight; cap any single asset at 45%.
-
Regime: if a broad risk-off signal triggers (e.g., trend breadth deterioration), shift up to 30% into stables.
-
Rebalancing: monthly; conditional tweaks only when regime flips.
-
Frictions: fee 0.10%, slippage 0.05%; liquidity filters applied.
Model B — 12-Month Momentum Tilt (No Explicit Regime Filter)
-
Universe: BTC, ETH, SOL; weights by relative momentum (12-month).
-
Floors/ceilings: laggards min 10%, leaders max 55% to avoid single-asset dominance.
-
Rebalancing: monthly rotation.
-
Same friction profile as Model A.
What we’ll test (in Part 2)
-
Which model shows lower Max DD and shorter time under water across windows?
-
Does Model B’s upside in strong bulls offset its vulnerability during rotations?
-
Does adding a minimal regime safeguard to Model B improve tolerability without killing CAGR?
Common Pitfalls in These Two Layers (and Quick Fixes)
Pitfall1 — Ignoring frictions in historical tests
-
Fix: Bake in fees/slippage/spreads; then double them to gauge sensitivity.
Pitfall2 — Survivorship bias
-
Fix: Build the universe as it existed. Delisted assets appear/disappear at their actual dates.
Pitfall3 — Look-ahead/data-snooping
-
Fix: Enforce indicator delays; freeze datasets before testing; don’t reuse future knowledge.
Pitfall4 — Over-parameterization
-
Fix: Use fewer knobs with economic intuition; prefer ranges with acceptable results over pinpoint “winners.”
Pitfall5 — Window games in walk-forward
-
Fix: Stick to a consistent window plan (e.g., 12–18 months) and evaluate the stitched curve—not just cherry-picked segments.
Pulling It Together (End of Part 1)
-
Historical backtests screen ideas and teach you the risk surface.
-
Walk-forward turns that into a durability exam—rolling out-of-sample, regime-aware, friction-consistent.
-
Keep rules simple and assumptions realistic. The goal isn’t a backtest trophy; it’s a policy you can live with.
Live / Paper Testing — Turning Designs into Real Execution
Backtests (historical + walk-forward) tell you what could have worked. Live/paper testing shows you whether your policy survives today’s regime under real frictions: spreads at the time you trade, order queueing, partial fills, API delays, maintenance windows, and your own discipline.
What to validate in live/paper
-
Execution quality: expected vs. actual fill; slippage on rebalance; spread at your usual trading hour.
-
Stability: do signals fire too often? does the cadence feel sustainable?
-
Behavioral load: can you follow rules during volatile weeks without tweaks?
-
Regime match: are conditions similar to windows where the policy behaved well?
Good practice
-
Start with paper or very small capital.
-
Keep a run log (date, trigger, symbol, allocation change, expected vs. actual fill, deviation cause).
-
Review weekly; adjust cadence (e.g., avoid rebalancing at volatile hours) before scaling.
Evaluation of Two Portfolio Models (A vs B)
Recall the designs from Part 1:
-
Model A — Equal-Weight + Regime Filter
Equal weight BTC/ETH/SOL; cap any single asset at 45%; if risk-off triggers, shift up to 30% into stables; monthly rebalance; fee 0.10%, slippage 0.05%. -
Model B — 12-Month Momentum Tilt (No Explicit Regime Filter)
Weights by relative momentum; floor 10% for laggards, cap 55% for leaders; monthly rotation; same frictions.
Below is a representative, copy-friendly table to show how to summarize results for investors. (Numbers are placeholders—you’ll replace with your actual backtest outputs.)
Table 1 — Investor Evaluation Snapshot (copy & paste)
Interpretation for investors
-
If drawdown tolerance and consistency matter most, Model A is usually easier to live with.
-
If you can stomach deeper DD for bull-market capture, Model B can be attractive—especially with a light regime safeguard (e.g., a simple trend filter or a small cash sleeve).
-
A pragmatic middle ground: blend (e.g., 60% A / 40% B), then re-test as one policy.
Live / Paper Rollout Plan (From Trial to Deployment)
Going live is not a flip of a switch—it’s a phased rollout with an audit trail. Use the checklist below as an internal SOP.
Table 2 — Phased Rollout Checklist (copy & paste)
Rules of thumb
-
Size conservatively at first; raise size only after live-small results align with walk-forward expectations.
-
Add price alerts for key thresholds (rebalance bands, risk-off triggers) so you act on rules, not emotions.
-
Schedule monthly and quarterly reviews: compare live metrics to backtest/forward panels; if frictions are higher than modeled, adjust cadence or weight caps.
Common Pitfalls in Live/Paper (and Quick Fixes)
-
Trading at the wrong hour → Spreads widen; slippage jumps.
Fix: choose a consistent execution window with thinner spreads; consider VWAP-style staging. -
Too many micro-signals → Operational fatigue; higher turnover and costs.
Fix: strengthen thresholds; rebalance on a schedule with conditional overrides. -
Rule drift → Ad-hoc overrides destroy test validity.
Fix: document any exception and its rationale; if the exception repeats, refactor the rule (don’t “wing it”). -
Ignoring regime clues → Forward test results diverge from expectations.
Fix: add a simple regime check (trend/breadth/volatility) before big allocation changes.
Putting It All Together — A Clean Investor Sequence
-
Historical backtest to find viable, explainable policies (not perfect curves).
-
Walk-forward to prove out-of-sample durability and parameter-range stability.
-
Live/Paper to validate execution reality and behavioral tolerability in the current regime.
-
Scale gradually, with alerts and scheduled reviews—treat deviations as data, not as reasons to improvise.
Natural internal links to add
-
From this article to the concept page: Backtesting vs Forward Testing: When & Why to Use Each.
-
From this article to the process page: Optimizing Your Crypto Backtesting.
-
Optional: gentle mentions of News Review (for regime context) and Price Alerts (for operationalizing thresholds).
Conclusion
The edge in crypto investing isn’t a secret parameter—it’s a repeatable process. By layering historical, walk-forward, and live/paper testing, you reduce both model risk and operational risk.
Related Forvest Tools in Our AI Assistant, Fortuna
Forvest Trust Score helps investors evaluate crypto projects based on real transparency and reliability metrics. It identifies trustworthy assets and highlights hidden risks, guiding you toward safer investment decisions.
Forvest Alerts keeps you informed about key market movements and sentiment shifts — not just prices, but also major news that may impact your portfolio — helping you stay proactive instead of reactive.
— Forvest Research
Rating of this post
Rate
If you enjoyed this article, please rate it.