


- TL;DR (Key Takeaways)
- What Is Crypto Portfolio Backtesting?
- Why It Matters for Long-Term Crypto Portfolios
- Data, Costs & Market Regimes
- A) Data Quality
- B) Costs & Liquidity
- C) Market Regimes
- Core Workflow: Step-by-Step
- Step 1 — Objective & Hypothesis
- Step 2 — Portfolio Rules
- Step 3 — Data & Frictions
- Step 4 — Simulation
- Step 5 — Evaluation
- Step 6 — Iterate Carefully
- Metrics That Matter (Investor Edition)
- Optimization vs Overfitting (How to Avoid It)
- Walk-Forward & Forward Testing (Turning Theory Into Durability)
- A) Walk-Forward Testing (Rolling Validation)
- B) Forward Testing (Paper or Limited Capital)
- A Practical Example: Comparing Two Portfolio Models
- Model A — Equal-Weight + Simple Regime Filter
- Model B — 12-Month Momentum Tilt
- Evaluation Snapshot (Illustrative)
- Walk-Forward Glimpse
- Common Pitfalls (and Quick Fixes)
- Tools & Setups for Investors (Practical, Not Dogmatic)
- From Backtesting to Action
- Closing Note
- Related Forvest Tools
Crypto portfolio backtesting applies fixed allocation and rebalancing rules to historical data to estimate how a portfolio would have behaved—not what it will earn. This guide focuses on investor decisions: drawdown, concentration, trading costs, bias control, and out-of-sample validation. Treat every result as an estimate shaped by the data and assumptions you choose.
TL;DR (Key Takeaways)
- Investor backtesting ≠ trader backtesting: focus on portfolios, regimes, and risk-adjusted results.
- Core metrics: CAGR, Max Drawdown, Sharpe/Calmar, consistency across sub-periods.
- Data quality, fees/slippage, liquidity affect reality more than models.
- Use simple, explainable rules; avoid overfitting with train/test splits and robustness checks.
- After testing, align with the current regime and monitor thresholds before real allocation.
What Is Crypto Portfolio Backtesting?
Investment backtesting is a disciplined simulation: you define portfolio rules, apply them to historical data, and observe how the strategy would have behaved over time. The emphasis is on repeatability and tolerability, not intraday precision.
How it differs from trader backtesting
- Unit of analysis: portfolio allocation policies (e.g., BTC/ETH/SOL + stables), not rapid entry/exit signals.
- Time horizon: weeks–months and multi-year cycles, not minute bars.
- Success: stable, risk-adjusted outcomes vs. peak raw returns.
- Cadence: scheduled or regime-based rebalancing, not constant micro-timing.
Bottom line: you’re testing whether a clear, simple policy behaves well enough across bull, bear, and sideways phases to be investable.
Why It Matters for Long-Term Crypto Portfolios
Crypto’s volatility punishes impulsive decisions. Backtesting helps investors:
- Replace emotion with pre-committed rules (allocation, rebalancing, de-risking triggers).
- Quantify downside: measure Max Drawdown, worst month/year, time under water.
- Build regime awareness: see where a policy shines and where it struggles.
- Create repeatability: a process you can defend and follow during stress.
The payoff is not just higher CAGR; it’s more livable performance—returns you can actually stick with.
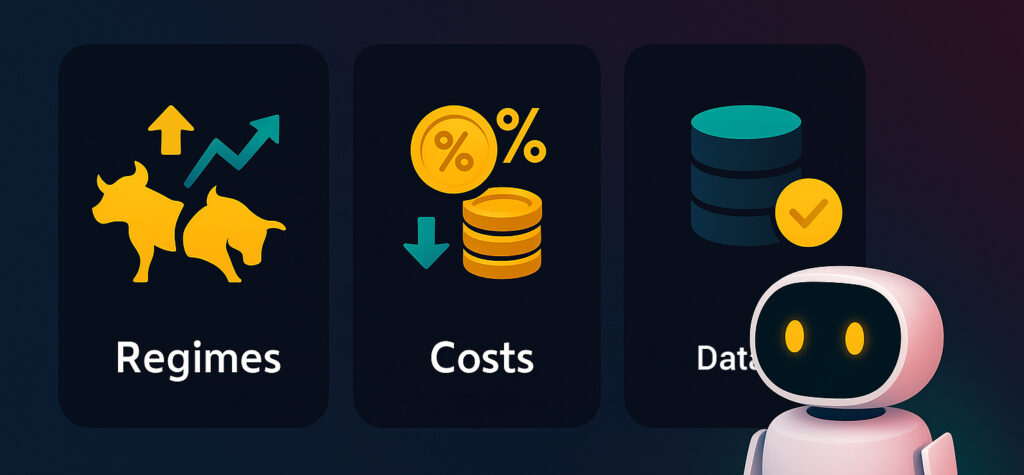
Three pillars of realistic backtests: data, costs, regimes.
Data, Costs & Market Regimes
Great math can’t rescue bad assumptions. Three levers decide realism:
Methodology note: The CFA Institute guide to investment model validation explains how look-ahead and survivorship bias can make a historical test appear stronger than it is. In crypto, point-in-time asset universes are especially important because projects can fail, delist, or become untradeable.
A) Data Quality
- Use credible sources; clean anomalies (re-denominations, delistings, stale ticks).
- Use enough point-in-time history to cover distinct regimes. A fixed year count alone does not guarantee a representative sample.
- Handle survivorship bias: include assets as they truly existed.
B) Costs & Liquidity
- Model fees, slippage, spreads; stress-test with conservative values.
- Rebalancing frequency multiplies costs—make it explicit.
- Enforce liquidity filters (volume, market-cap) to avoid unrealistic fills.
Build costs from observable inputs: the venue’s fee schedule, bid-ask spread, order size relative to available liquidity, expected slippage, and any relevant network or funding costs. Then rerun the test with worse assumptions to see whether the conclusion survives.
C) Market Regimes
- Label periods: bull / bear / range.
- Examine regime sensitivity: if results hinge on one phase, risk is higher.
- Prefer acceptable behavior across phases, even if it’s not “best” in any single one.
If fees/slippage/liquidity are ignored, you’re grading fantasy, not strategy.
Core Workflow: Step-by-Step
Step 1 — Objective & Hypothesis
- Define what matters: stability, capped drawdowns, lower variance, or growth with constraints.
- Example hypothesis: “A simple regime filter (risk-off to stables in deep downtrends) reduces Max DD while preserving most CAGR.”
Step 2 — Portfolio Rules
- Universe: which assets (BTC, ETH, SOL, stables…).
- Allocation: equal weight, risk-based, momentum tilt, caps/floors per asset.
- Signals: regime filters (trend, breadth, volatility), or valuation bands.
- Rebalancing: monthly/quarterly or conditional (only when triggers fire).
Step 3 — Data & Frictions
- Timeframe: daily/weekly bars suit investors.
- Costs: fees + slippage; test sensitivity to higher frictions.
- Liquidity: enforce minimum thresholds; exclude thin assets.
Step 4 — Simulation
- Split in-sample (design) vs. out-of-sample (validation).
- At each timestamp, use only information that would have been available then; shift signals and executions when the data timing requires it.
Step 5 — Evaluation
- Track CAGR, Max DD, Sharpe/Calmar, worst year/month, time under water.
- Check stability by sub-period (per-year stats).
- Inspect the equity curve: is the path livable?
Step 6 — Iterate Carefully
- Change one thing at a time; seek robustness improvements, not record highs.
- Prepare for walk-forward validation (Part 2).
 Related: How to Backtest a Crypto Investment Strategy: Step-by-Step
Metrics That Matter (Investor Edition)
| Metric | What it tells you | Investor use |
|---|---|---|
| CAGR | Compound annual growth | Long-run compounding strength |
| Max Drawdown | Deepest peak-to-trough loss | Pain ceiling; capital at risk |
| Sharpe | Return per unit of volatility | Quality/consistency of outcomes |
| Calmar | CAGR / Max DD | Growth per unit of worst pain |
| Ulcer Index | Depth & duration of drawdowns | Psychological stress over time |
| Hit Rate & Avg Win/Loss | Distribution profile | Are results steady or concentrated? |
Interpretation tips
- In crypto, Max DD can dominate behavior; investors abandon unlivable paths.
- Sharpe/Calmar compare strategies with similar CAGR but different risk quality.
- Per-year stability matters; a “one-year wonder” often signals regime dependency.
- Time under water tests discipline more than a brief deep dip.
Optimization vs Overfitting (How to Avoid It)
Overfitting means the strategy memorized the past. Your edge should survive small changes and new data.
Common overfitting tells
- Fragile, micro-tuned parameters (EMA 47 works, EMA 48 fails).
- Too many knobs (8–10 parameters) with accidental interactions.
- Single-regime success; poor elsewhere.
- Performance collapses when realistic costs are applied.
Defenses that work
- Train/Test split with a clean validation window.
- Walk-forward re-estimation in rolling windows (covered in Part 2).
- Robustness checks: parameter sweeps, Monte Carlo/bootstrapping, cost sensitivity.
- Prefer fewer, explainable rules with economic intuition.
Related: Backtest Optimization: Avoid Overfitting & Improve Robustness
If a tiny parameter nudge breaks results, there’s no edge—just curve-fit.
Walk-Forward & Forward Testing (Turning Theory Into Durability)
Backtests can look brilliant—until they face new, unseen data. That’s why investors rely on two validators:
A) Walk-Forward Testing (Rolling Validation)
Divide history into sequential windows (e.g., 12–18 months). In each window:
- Estimate parameters modestly on the first sub-window.
- Test those parameters on the next sub-window.
- Roll the window forward and chain results.
This produces a stitched equity curve across changing conditions, revealing whether the strategy adapts to regime shifts or only thrives in one phase.
Execution principles
- Don’t make windows too short (noise) or too long (overfit to an era).
- Keep parameter ranges simple and bounded—you’re targeting robustness, not backtest records.
- Evaluate the full panel: CAGR, Max Drawdown, Sharpe/Calmar, per-window consistency, and time under water.
Learn the practical differences in our guide to backtesting vs forward testing
B) Forward Testing (Paper or Limited Capital)
After walk-forward, deploy the strategy on fresh data—either paper trading or with small capital. Validate the practical frictions you modeled: rebalancing cadence, execution delay, spreads at the time you actually trade, and unplanned market events.
Purpose: before meaningful allocation, confirm that your process behaves in the current regime and under real execution constraints.
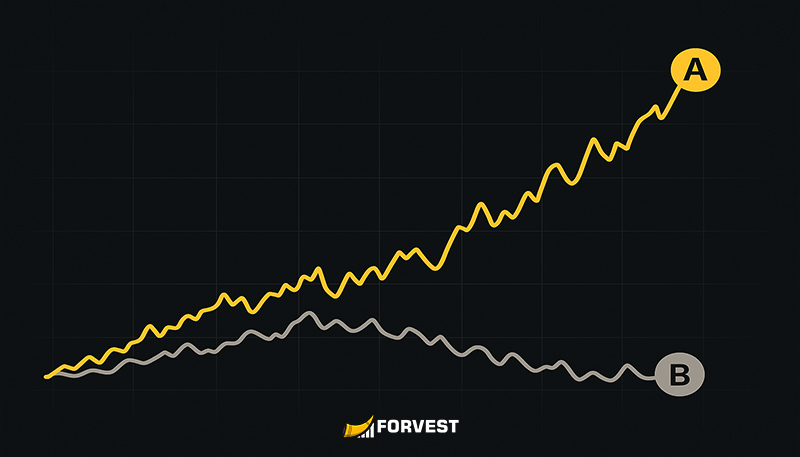
Equity-curve behavior: Model A steadier; Model B more volatile.
A Practical Example: Comparing Two Portfolio Models
Numbers below are illustrative—designed to show how to evaluate, not to prescribe a specific system.
Shared assumptions
- Universe: BTC, ETH, SOL (+ stables in risk-off)
- Period: 5 years
- Timeframe: weekly
- Costs: 0.10% fee per trade; 0.05% slippage
- Rebalancing: monthly, unless a conditional rule triggers
Model A — Equal-Weight + Simple Regime Filter
- Equal weight across BTC/ETH/SOL.
- If a regime indicator (e.g., broad trend deterioration) flags deep risk-off, shift up to 30% into stables.
- Cap any single asset at 45% to prevent single-asset dominance.
Model B — 12-Month Momentum Tilt
- Weights determined by 12-month relative momentum.
- Floor weight for laggards: 10%; cap for leaders: 55%.
- No explicit regime filter; risk is managed through dynamic rotation.
Evaluation Snapshot (Illustrative)
| Metric | Model A | Model B |
|---|---|---|
| CAGR | Moderate to good | Higher in strong bull cycles |
| Max Drawdown | Lower due to regime de-risking | Deeper in sharp rotations |
| Sharpe | More stable | More volatile |
| Calmar | Often favorable (DD control) | Weaker in bear phases |
| Worst Year | Less painful | Can be worse |
| Time Under Water | Shorter | Longer in slow recoveries |
Investor takeaways
- In this hypothetical comparison, Model A has the more tolerable drawdown path. That is an assumption-driven illustration, not evidence that this model will outperform.
- If you can accept deeper drawdowns for higher bull-market capture, Model B may appeal.
- A pragmatic middle ground: blend (e.g., 60% A / 40% B), then re-test as a single portfolio policy.
Walk-Forward Glimpse
In illustrative 12–18-month rolling windows, the comparison might show:
- Model A delivering steadier outcomes across windows (benefit of regime-aware de-risking).
- Model B excelling in bull windows but wobbling during transitions or range-bound periods.
- If you favor Model B’s upside, a minimal regime safeguard or small cash buffer can materially improve tolerability.
Related: Learn more about Types of Investment Backtests: Historical, Walk-Forward & Live
Common Pitfalls (and Quick Fixes)
1) Ignoring Frictions (Fees, Slippage, Liquidity)
- Tell: Results weaken sharply when you add plausible fees, spread, and slippage.
- Fix: Model frictions realistically; reduce turnover; avoid illiquid assets; consider conditional or less frequent rebalancing.
2) Look-Ahead & Data Snooping
- Tell: A signal or universe filter uses information that was not available at the simulated decision time.
- Fix: Timestamp every input, lag features where necessary, execute on a later tradable price, and keep chronological design and validation windows separate.
3) Survivorship Bias
- Tell: Your universe includes only today’s survivors.
- Fix: Reconstruct historical universes; include delisted/failed assets in their actual time windows.
4) Over-Parameterization
- Tell: 8–10 sensitive knobs; results break with tiny changes.
- Fix: Fewer, explainable rules; parameter stability checks; prioritize economic intuition over curve-fit gains.
5) Single-Regime Hero
- Tell: Great in bull, fragile elsewhere.
- Fix: Add a simple regime filter (trend/volatility) or a small cash sleeve with clear triggers.
6) Misaligned Timeframes
- Tell: Intraday logic for long-horizon investing decisions.
- Fix: Use daily/weekly data for investor policies; leave intraday tactics to trading contexts.
7) Path Dependence Blindness
- Tell: Attractive CAGR hides intolerable equity-curve behavior.
- Fix: Review worst month/year, time under water, and rolling Sharpe—behavior matters as much as totals.
8) Skipping Forward Discipline
- Tell: Glowing backtest, no real-time validation plan.
- Fix: Commit to forward testing (paper or small capital) before scaling.
Related: Common Backtesting Mistakes to Avoid in Crypto Investing
Tools & Setups for Investors (Practical, Not Dogmatic)
A) Ready-Made Platforms (No-/Low-Code)
Good for fast iteration and visualization—provided you can control data quality, frictions, and rebalancing logic. Prefer platforms that expose assumptions clearly and let you export results for audit.
B) Code-Based (Python/R)
Maximum flexibility for portfolio rules, robustness testing, and custom metrics. Demands time and documentation discipline. Ideal if you need regime labels, parameter sweeps, and sensitivity analysis under one roof.
C) Process Standards (tool-agnostic)
- Data & cost profiles: define standard fee/slippage assumptions so results are comparable across tests.
- Versioning: timestamp every ruleset change with rationale.
- Reproducibility: periodic re-runs to detect drift or dependency on stale assumptions.
- Risk reports: include Max DD, Calmar, worst period, and time-under-water alongside CAGR in every output.
From Backtesting to Action
Backtesting is not the finish line. It is the start of a disciplined validation process.
- Compare the present with tested conditions. Document which volatility, liquidity, and trend regimes the policy handled—and where it failed.
- Translate rules into observable thresholds. Define allocation bands, rebalance conditions, and review dates before emotion is involved.
- Forward test first. Use paper trading or a limited allocation to measure real spreads, slippage, execution delay, and operational mistakes.
- Scale only if the evidence remains consistent. Compare live observations with the assumptions in the test and stop when they materially diverge.
Principle: a useful strategy is one you can explain, monitor, and execute through unfavorable periods—not the one with the most attractive historical curve.
Closing Note
Crypto portfolio backtesting helps you understand how a rule set responded to past conditions. Walk-forward and forward testing expose it to new information; disciplined sizing and monitoring make the remaining uncertainty manageable. The objective is a more robust process, not a promise about future returns.
Related Forvest Tools
Forvest Portfolio Management helps you track allocation and concentration as a tested policy moves into paper or limited-capital forward testing.
Forvest Trust Score adds structured project-risk context when you define or review the assets included in a historical universe.
Forvest Alerts can monitor predefined price, news, and portfolio conditions. Alerts are notifications, not trading signals.
Backtests are hypothetical, depend on assumptions, and do not guarantee future performance. This article is educational and not individualized investment advice.
— Forvest Research