


Short answer: Crypto market regime analysis classifies the current environment—trend, volatility, liquidity, participation and positioning—so investors can test whether a strategy’s assumptions still fit. It describes conditions; it does not predict the next price.
| Regime | Typical evidence | Risk implication |
|---|---|---|
| Uptrend / orderly | Higher highs, broad participation, stable liquidity | Trend rules may fit, but crowding can rise |
| Downtrend / risk-off | Lower lows, weak breadth, defensive flows | Reduce assumptions about liquidity and recovery |
| Range / low volatility | Repeated boundaries, compressed realized volatility | Breakouts may fail; fees can dominate |
| Volatility expansion | Wider ranges, rising liquidations, unstable spreads | Position and execution risk increase |
| Transition | Indicators disagree or change quickly | Confidence should be lower |
No regime label is certain. Define the classification rule before using it and record when the evidence disagrees.
What Is a Crypto Market Regime?
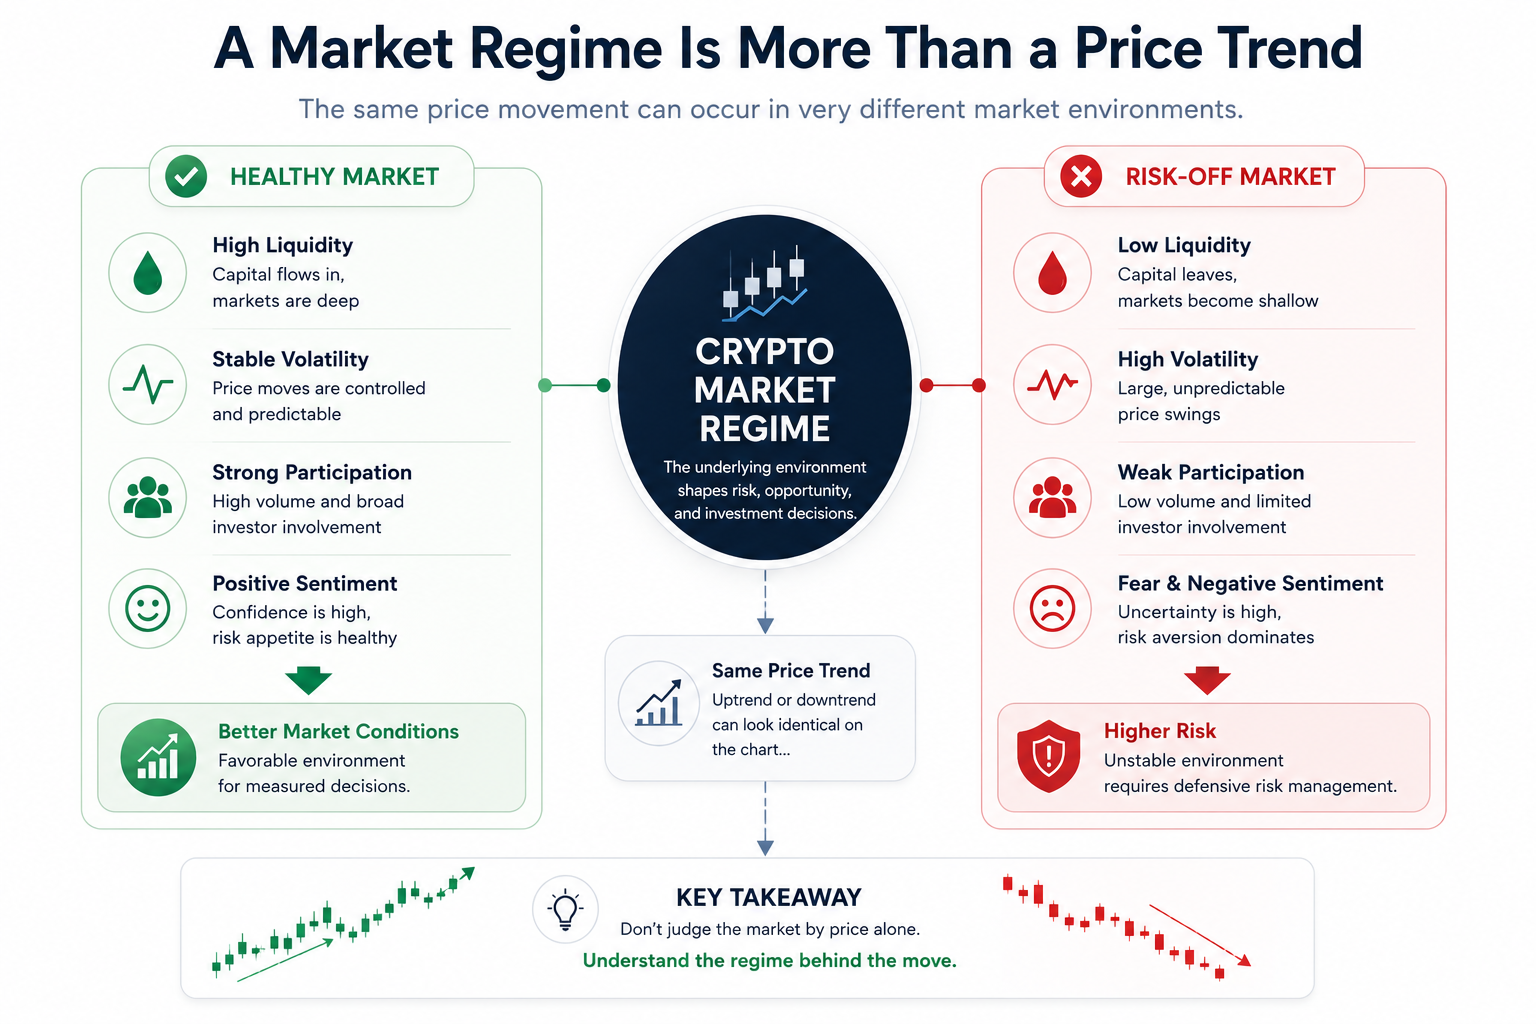
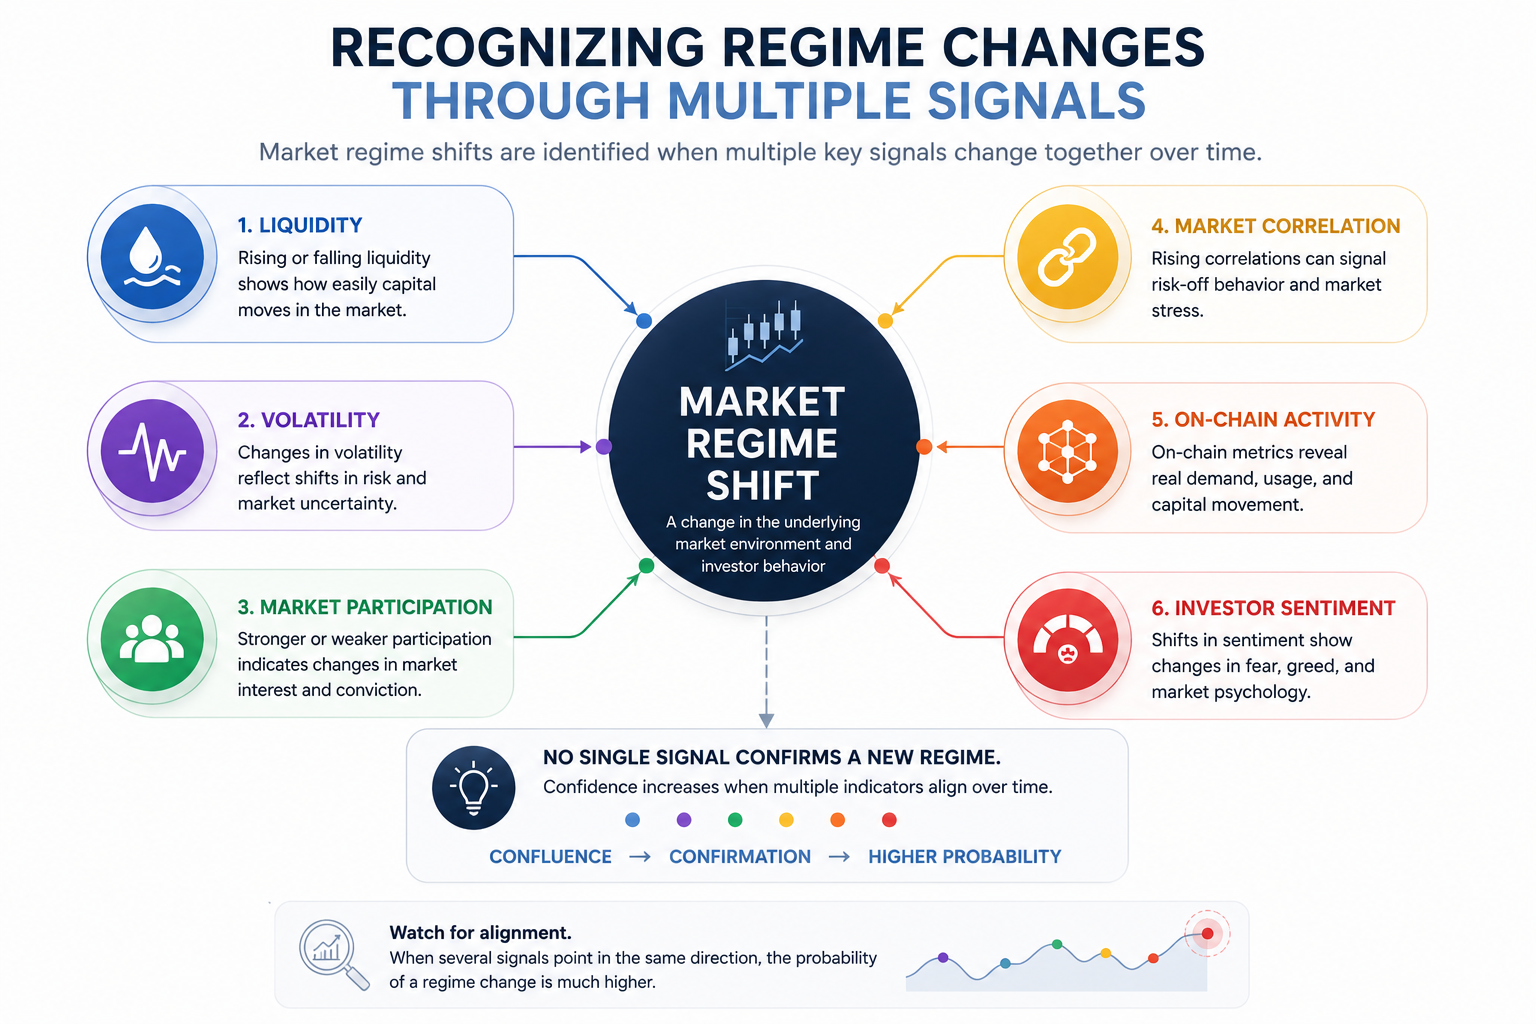
A regime is a persistent combination of market conditions, not one candle or headline. A simple model separates direction and volatility; a stronger model also checks liquidity, breadth, derivatives positioning, on-chain activity and sentiment.

The Five Evidence Layers
1. Trend and Market Structure
Use a documented rule such as moving-average direction, higher highs/lows or a fixed lookback return. Avoid labeling a regime from visual intuition alone.
2. Volatility
Compare realized volatility, range and gap behavior with their own history. High volatility can exist in both rising and falling markets.
3. Liquidity and Execution
Watch spread, order-book depth, stablecoin/fiat access and price impact. A strategy tested in deep liquidity may fail when execution deteriorates.
4. Breadth and Participation
Check whether a move is supported by many liquid assets or only a few large tokens. Weak breadth can make an index-level trend less robust.
5. Positioning and Sentiment
Funding, open interest, liquidations and sentiment indexes can reveal crowding. These signals are context, not automatic contrarian trades.
A Reproducible Classification Rule
For an educational example, define direction from a fixed moving-average or return rule and volatility from a percentile of past realized volatility. The combination creates four states: rising/quiet, rising/volatile, falling/quiet and falling/volatile. Add “transition” when inputs disagree.
Published research supports testing for regime changes rather than assuming one stable volatility process: Ardia, Bluteau and Rüede (2019) found regime changes in Bitcoin volatility using Markov-switching GARCH models. This page’s four-state rule is a simpler educational diagnostic, not their model and not a forecast.
Choose thresholds before examining strategy performance. Changing the labels after seeing results creates look-ahead bias.
Step-by-Step Regime Review
- Set the asset universe and timeframe.
- Calculate trend and volatility with fixed rules.
- Check liquidity and breadth for confirmation.
- Review positioning, liquidations and sentiment.
- Assign a label plus a confidence level.
- Record conflicting evidence and the next review date.
- Test how the strategy performed in comparable historical states.
Example Regime Dashboard
| Indicator | Observation | Interpretation | Confidence effect |
|---|---|---|---|
| Trend | Positive | Directional support | Raises |
| Volatility | Expanding | Execution and drawdown risk | Lowers |
| Breadth | Narrow | Move is not widely supported | Lowers |
| Funding | Elevated | Potential crowding | Lowers |
| Liquidity | Stable | Execution still functional | Raises |
The example should be labeled “uptrend with elevated volatility and low confidence,” not simply “bull market.”
How Regime Analysis Changes Decisions
Regime analysis should change assumptions, not force a trade. It can guide the frequency of reviews, stress scenarios, position limits, expected slippage and whether a strategy should be paused. It cannot tell you exactly when a transition will occur.
Use the crypto risk framework to translate the label into risk controls.
Test Strategies by Regime
Report net return, maximum drawdown, turnover and trade count separately for each state. Use only information available at the time to assign a regime. Reserve unseen data and test transitions, because a full-history average can hide dependence on one favorable environment.
See the crypto backtesting guide and the seven-step strategy framework.
Common Mistakes
- Defining “bull” or “bear” after seeing the outcome
- Using only price direction
- Ignoring liquidity and execution costs
- Treating a sentiment extreme as a reversal guarantee
- Using thresholds fitted to one market cycle
- Changing portfolio exposure from a low-confidence label
Weekly Regime Checklist
- Have trend and volatility rules changed?
- Is participation broad or concentrated?
- Are spreads and market depth stable?
- Do funding and open interest show crowding?
- Does sentiment confirm or conflict?
- What evidence would change the label?
- Which strategy assumptions should be retested?
Combine this workflow with crypto sentiment analysis and technical analysis without treating any one layer as a prediction engine.