


Fundamental vs Technical vs Quantitative Analysis is one of the most important comparisons investors face when building a market strategy. Whether you invest in stocks, cryptocurrencies, ETFs, or other financial assets, choosing the right analytical approach can influence how you identify opportunities, manage risk, and make long-term decisions. In today’s data-driven markets, understanding the strengths and limitations of each method is becoming increasingly important.
Cryptocurrency investors, stock traders, and portfolio managers all face the same challenge: making decisions in uncertain markets. Prices move constantly, news changes sentiment overnight, and thousands of data points compete for attention.
Before treating a headline as an analytical input, investors should analyze crypto news by checking the original source, evidence level, relevance, and time horizon.
In this environment, relying on instinct alone is rarely enough. Instead, investors increasingly rely on structured tools such as a crypto profit calculator to evaluate portfolio performance, risk, and real returns across different market conditions.
This is where market analysis becomes essential.
What Are Market Analysis Approaches?
At the highest level, market analysis is the process of evaluating assets, markets, and investment opportunities before making decisions.
Rather than guessing, investors use structured frameworks to understand value, identify trends, and estimate potential outcomes.
Although dozens of analytical methods exist, most investment decisions ultimately rely on one or more of three core approaches:
| Analysis Method | Primary Focus | Main Goal |
|---|---|---|
| Fundamental Analysis | Value and intrinsic worth | Identify undervalued or overvalued assets |
| Technical Analysis | Price action and market behavior | Improve trade timing |
| Quantitative Analysis | Data, statistics, and probability | Build systematic decision models |
While these approaches often overlap, their underlying philosophy is very different.
Fundamental analysts ask whether an asset is worth buying.
Technical analysts ask whether current market conditions support buying.
Quantitative analysts ask what historical data suggests is most likely to happen next.
Understanding this distinction is the first step toward choosing the right framework.
Key Insight: The biggest mistake investors make is assuming all analysis methods are trying to answer the same question.
Fundamental vs Technical vs Quantitative Analysis: A Quick Comparison
Before exploring each method individually, it helps to understand how they differ at a strategic level.
The Three-Lens Market Analysis Framework
One of the simplest ways to compare market analysis approaches is to think of them as three separate lenses.
| Lens | Core Question | Primary Objective |
|---|---|---|
| Fundamental Analysis | Is this asset valuable? | Identify long-term value |
| Technical Analysis | Is now the right time? | Improve entry and exit timing |
| Quantitative Analysis | What does the data suggest? | Improve probability-based decisions |
This framework highlights something many investors overlook.
The methods are not necessarily competing with one another.
Instead, they focus on different dimensions of decision-making.
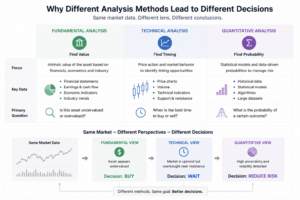
For example, a long-term investor researching a company may use fundamental analysis to determine whether the business has strong growth potential. A trader might use technical analysis to identify favorable entry points. A quantitative analyst could test hundreds of historical scenarios to evaluate the probability of success under different market conditions.
Each approach contributes a different piece of the puzzle.
That is why many professional investors combine multiple forms of analysis rather than relying exclusively on one methodology.
What Is Fundamental Analysis in Market Analysis?
Fundamental analysis focuses on determining the intrinsic value of an asset.
The central idea is straightforward: every asset has an underlying value that may differ from its current market price. Investors attempt to identify that value by examining factors that influence long-term performance.
In traditional markets, this often includes:
- Revenue growth
- Earnings performance
- Profit margins
- Cash flow
- Competitive advantages
- Industry conditions
- Macroeconomic trends
In cryptocurrency markets, the framework expands to include additional factors such as tokenomics, network adoption, liquidity, on-chain activity, and developer participation, which are essential components of fundamental analysis in crypto for evaluating long-term project value and investment potential.
The goal remains the same.
Investors want to determine whether the market is accurately pricing an asset or whether a significant gap exists between price and value.
For this reason, fundamental analysis is commonly associated with long-term investing.
Rather than reacting to short-term volatility, investors focus on the underlying drivers that may influence value over months or years.
However, fundamental analysis has limitations.
Even when an investor correctly identifies a high-quality asset, the market may take a long time to recognize that value. Price and value do not always move together in the short term.
This creates a challenge that fundamental analysis alone cannot fully solve.
And that challenge is exactly where technical analysis enters the picture.
Technical Analysis: Using Price and Market Trends
While fundamental analysis focuses on value, technical analysis focuses on behavior.
Instead of asking whether an asset is worth buying, technical analysts ask a different question:
What is the market most likely to do next?
This distinction is important because markets do not always move according to intrinsic value. Even a fundamentally strong asset can decline for weeks or months if sentiment weakens, liquidity dries up, or traders begin taking profits.
Technical analysis attempts to understand these movements by studying price action, trading volume, volatility, and recurring market patterns.
The core assumption behind technical analysis is simple: market participants often behave in predictable ways. Fear, greed, optimism, and panic tend to leave visible footprints on charts, which means past behavior can sometimes provide clues about future behavior.
For this reason, technical analysis is especially popular among active traders, swing traders, and short-term investors.
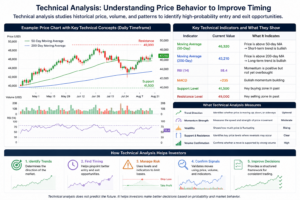
Rather than examining earnings reports, tokenomics, or industry trends, technical analysts typically focus on factors such as:
- Price trends
- Support and resistance levels
- Trading volume
- Market momentum
- Volatility
- Technical indicators such as RSI and MACD
The goal is not necessarily to determine whether an asset is valuable. Instead, the goal is to identify favorable entry and exit opportunities.
Key Insight: Fundamental analysis helps investors decide what to buy. Technical analysis helps determine when to buy or sell.
However, technical analysis is not a crystal ball.
Charts reflect market behavior, but they cannot explain why that behavior exists. A breakout pattern may look bullish, yet a negative earnings report, regulatory announcement, or macroeconomic event can quickly invalidate the signal.
This limitation is one reason many professional investors avoid relying on technical analysis in isolation.
Quantitative Analysis: A Data-Driven Investing Approach
If fundamental analysis focuses on value and technical analysis focuses on timing, quantitative analysis focuses on probability.
Rather than relying primarily on human interpretation, quantitative analysts use mathematical models, statistical methods, historical datasets, and algorithmic frameworks to make decisions, often supported by financial data platforms and research tools that provide large-scale datasets for statistical analysis and backtesting.
The objective is to remove as much emotion as possible from the investment process.
A quantitative model may evaluate thousands of historical observations and ask questions such as:
- Which factors consistently outperform the market?
- How does volatility affect expected returns?
- Which conditions increase the probability of success?
- How much risk exists in a particular strategy?
Because quantitative analysis is data-driven, it is widely used by hedge funds, institutional investors, algorithmic traders, and systematic portfolio managers.
Unlike technical analysis, which often relies on chart interpretation, quantitative analysis attempts to test ideas objectively through data and backtesting.
For example, a quant investor may discover that a specific combination of momentum, volatility, and liquidity factors historically produced better risk-adjusted returns than the broader market.
Instead of making decisions based on intuition, the investor follows the model.
Yet quantitative analysis also has weaknesses.
Markets change. Relationships break down. Models that performed well in the past may stop working when market conditions shift.
This is known as model risk, and it remains one of the biggest challenges in quantitative investing.
Key Insight: Quantitative analysis does not predict the future. It estimates probabilities based on available data.
Fundamental vs Technical vs Quantitative Analysis: Which Method Works Best?
After understanding the strengths and limitations of each approach, the next question becomes obvious:
Which analysis method produces the best investment decisions?
The answer is not as simple as choosing a winner.
In reality, fundamental analysis, technical analysis, and quantitative analysis were designed to solve different problems. Comparing them directly is similar to comparing a compass, a map, and a GPS. Each provides useful information, but each serves a different purpose.
This is why experienced investors rarely rely on a single method.
Instead, they focus on matching the right analytical framework to the right objective.
Best Method by Investment Goal
The effectiveness of an analysis method depends largely on what an investor is trying to achieve.
| Investment Goal | Most Suitable Approach |
|---|---|
| Finding undervalued assets | Fundamental Analysis |
| Timing entries and exits | Technical Analysis |
| Managing probabilities and risk | Quantitative Analysis |
| Building systematic strategies | Quantitative Analysis |
| Long-term investing | Fundamental Analysis |
| Active trading | Technical Analysis |
| Institutional portfolio management | Quantitative Analysis |
For example, a long-term investor evaluating a company, cryptocurrency project, or ETF is typically more concerned with value than short-term price fluctuations.
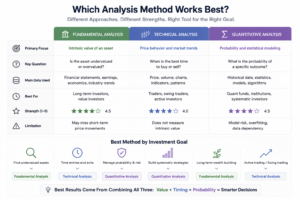
A swing trader, however, may care far more about momentum, support levels, and market sentiment.
Meanwhile, a quantitative fund managing hundreds of positions simultaneously requires scalable systems that can evaluate large datasets efficiently.
This illustrates an important principle:
No analysis method is universally superior. Success depends on how well the method matches the objective.
How Analysis Methods Change in Crypto Markets
The debate becomes even more interesting when cryptocurrency markets enter the picture.
Traditional markets provide structured financial data, earnings reports, and valuation metrics. Crypto markets introduce an entirely new layer of information.
Investors can now analyze:
- Tokenomics
- On-chain activity
- Wallet behavior
- Exchange flows
- Liquidity trends
- Network adoption
- User growth
As a result, crypto investors often combine multiple frameworks simultaneously.
A typical crypto research process might look like this:
- Use fundamental analysis to evaluate token utility, adoption, and long-term value.
- Use technical analysis to identify favorable market timing.
- Use quantitative analysis to assess probability, risk, and portfolio exposure.
This hybrid approach has become increasingly common because cryptocurrency markets are more volatile and data-rich than traditional asset classes.
Rather than replacing one another, the three approaches become complementary layers within a larger decision-making process.
The Hybrid Analysis Framework
One of the biggest gaps in competitor content is that most articles treat these approaches as competing systems.
Professional investors often do the opposite.
They combine them.
A practical framework looks like this:
Step 1: Fundamental Analysis
Determine whether an asset deserves attention.
Questions include:
- Does the project solve a real problem?
- Is adoption growing?
- Does the asset have sustainable value?
- Are the fundamentals improving?
Step 2: Technical Analysis
Determine whether market conditions support action.
Questions include:
- Is momentum strengthening?
- Is the trend healthy?
- Is volume supporting the move?
- Are risk-reward conditions attractive?
Step 3: Quantitative Analysis
Validate assumptions using data.
Questions include:
- What do historical outcomes suggest?
- What is the probability of success?
- What level of risk exists?
- Does the opportunity fit portfolio objectives?
To apply these insights in real investment scenarios, it is important to understand how to calculate crypto profit accurately with fees and real market conditions to validate your investment decisions.
Fundamental analysis finds opportunities. Technical analysis improves timing. Quantitative analysis improves probability.
Common Mistakes Investors Make
Even strong analytical frameworks can produce poor outcomes when applied incorrectly.
One of the most common mistakes is becoming overly attached to a single methodology.
For example:
- Fundamental investors may ignore changing market sentiment.
- Technical traders may overlook deteriorating fundamentals.
- Quantitative investors may place too much trust in historical models.
Another frequent mistake is confusing data with certainty.
Markets are probabilistic by nature. No framework can predict the future with perfect accuracy.
The goal of analysis is not to eliminate uncertainty.
The goal is to make better decisions despite uncertainty.
Investors who understand this distinction tend to manage risk more effectively and avoid many of the emotional mistakes that hurt long-term performance.
Final Thoughts
The debate around fundamental vs technical vs quantitative analysis often starts with the wrong question.
Most investors ask which method is best.
A more useful question is:
Which method is best for the decision I am trying to make?
Fundamental analysis helps investors understand value.
Technical analysis helps them understand market behavior.
Quantitative analysis helps them understand probability.
Each approach provides a different perspective on the same market.
Used independently, each has strengths and weaknesses. Used together, they create a more complete framework for decision-making.
The most effective investors are rarely loyal to a single methodology. Instead, they select the right tool for the right situation, combine multiple sources of information, and remain flexible as market conditions evolve.
In today’s increasingly data-driven markets, that flexibility may be one of the most valuable advantages an investor can develop.