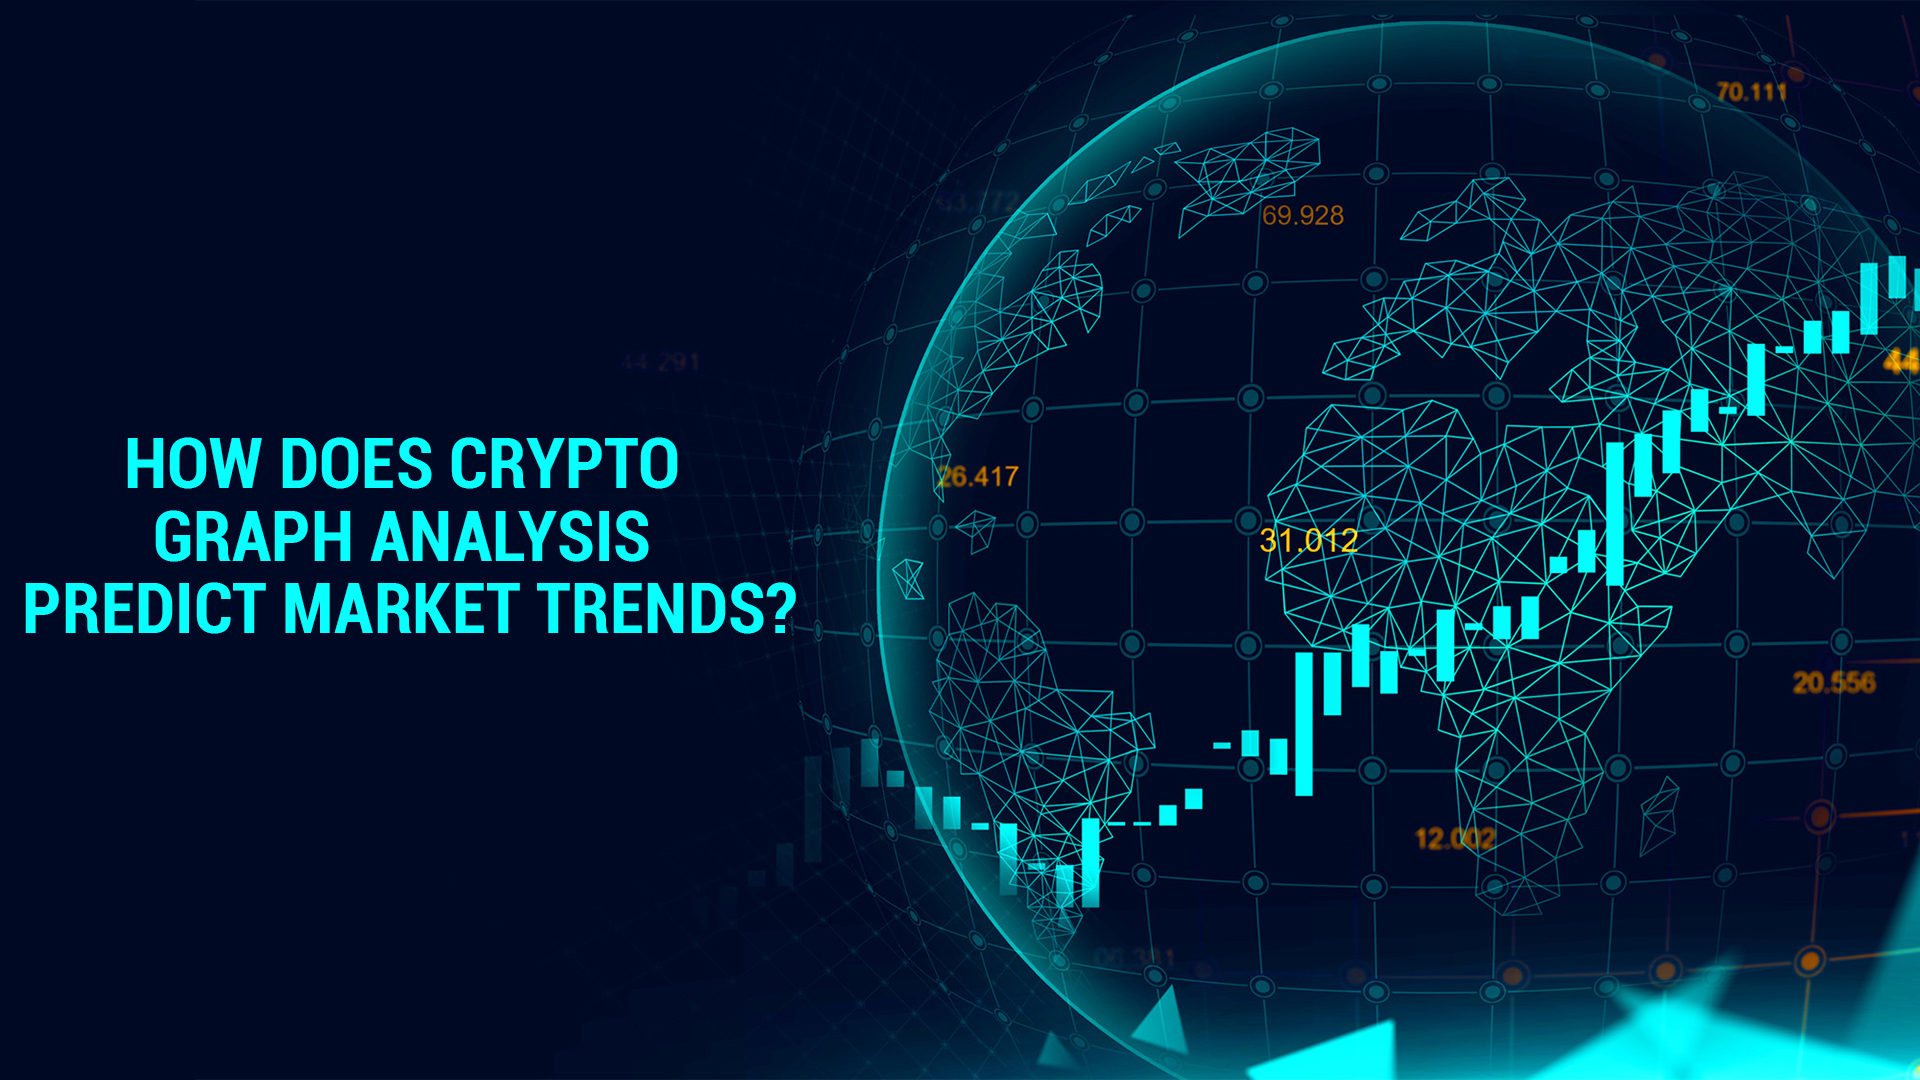
How Does Crypto Graph Analysis Predict Market Trends?
Ever felt like the crypto universe is a maze? You’re not alone. Amidst the buzz and tech-talk, there’s one tool that acts like our trusty compass: crypto graph analysis. Think of it as our way of reading the crypto tea leaves. It’s about studying past and present patterns on cryptocurrency charts to make educated guesses about where things might head next. It’s not just about cold, hard data; it’s also about feeling the pulse of the market. For both the seasoned trader and the curious newbie, getting a grip on crypto graph analysis is a game-changer. It’s like having a flashlight in a dark forest, showing us the way amidst the wild price swings and market shifts. In this piece, we’re going to unpack the magic of crypto graph analysis, exploring its ins and outs, and why it’s a must-have tool in any crypto enthusiast’s toolkit. Ready to dive in? Let’s chart our course through the fascinating waters of cryptocurrency analysis.
The Mechanics Behind Cryptocurrency Graph Analysis
Ever felt like the crypto market is a rhythmic dance, with its highs, lows, and sudden twirls? Well, crypto graph analysis is our way of understanding this dance, of predicting the next move in this dynamic tango.
Historical Data and Trend Lines
History often has a way of repeating itself, especially in the crypto world. By delving into historical data, we get a glimpse of a cryptocurrency’s journey. Trend lines, drawn from this data, act like breadcrumbs, hinting at possible future paths. It’s akin to retracing a dancer’s steps, predicting where they might leap next based on where they’ve been.
Volume Analysis
But it’s not just about the steps; it’s also about the intensity. Trading volumes are like the beats to which the market dances. A crescendo in volume often signals a significant move, be it a graceful pirouette or a dramatic dip. Monitoring these volume shifts is crucial, as they offer a peek into the market’s mood and momentum.
Crypto Graph Analysis Live: The Pulse of the Market
In the crypto ballet, every second counts. With live crypto graph analysis, we’re not just spectators; we’re part of the performance. Witnessing real-time shifts, armed with tools like the crypto market chart analysis, gives traders the agility to move with the market, to be in sync with its rhythm.
In a nutshell, understanding the intricacies of cryptocurrency graph analysis is like having a choreographer’s notes in a dance performance, offering clarity amidst the whirl and twirl of the crypto stage.
Key Indicators Used in Crypto Graph Analysis
Incorporating these tools into your crypto data analytics toolkit can significantly enhance your understanding and proficiency in the crypto market. As with any tool, the key lies in understanding its application and interpreting its signals in the broader context of market dynamics.
Moving Averages
One of the foundational tools in crypto graph analysis is the concept of moving averages. At its core, moving averages help traders smooth out price data, creating a single flowing line, which makes it easier to identify the direction of the trend. There are two main types: the simple moving average (SMA) and the exponential moving average (EMA). While the SMA gives equal weight to all days in the period, the EMA gives more weight to recent prices, making it more responsive to new price changes.
Relative Strength Index (RSI)
Dive a bit deeper into cryptocurrency graph analysis, and you’ll encounter the RSI. This momentum oscillator measures the speed and change of price movements, oscillating between zero and 100. Traditionally, and very generally, an RSI above 70 indicates that a coin might be overbought, suggesting it could be due for a price correction. Conversely, an RSI below 30 suggests a coin might be oversold and could be undervalued.
Fibonacci Retracement Levels
For those who love blending a bit of ancient math with modern-day crypto, Fibonacci retracement levels are a treat. By taking two extreme points on a crypto chart, traders can identify potential support and resistance levels. These levels, derived from the Fibonacci sequence, can help predict areas where there might be price reversals. It’s like having a roadmap of potential pit stops and detours in the journey of a cryptocurrency’s price.
Unraveling the Complex Web of Cryptocurrency Graph Analysis
Crypto graph analysis, while a potent tool in a trader’s arsenal, isn’t without its quirks and challenges. Let’s be real: if there was a foolproof way to predict every market move, we’d all be crypto millionaires by now. Historical data, as rich and revealing as it might be, is just that – history. It gives us patterns, not prophecies. The crypto realm, young and ever-fluctuating, often throws curveballs that no graph can foresee.
Then there’s the world outside the charts. A tweet here, a policy change there, or global economic shifts can send ripples through the crypto pond. Solely leaning on graph analysis can leave us blindsided to these external tremors.
And let’s not even get started on the dizzying array of tools and indicators. It’s like being in a candy store with endless choices; sweet, but potentially overwhelming. The risk? Getting bogged down, unable to make a move.
But perhaps the trickiest challenge is our own emotions. Fear, excitement, greed – they can all skew our interpretation of what the graphs are telling us. Even the most seasoned traders aren’t immune to this.
So, where does this leave us? Cryptocurrency graph analysis is undeniably valuable, but it’s just one piece of the puzzle. It’s vital to blend it with other research, keep a finger on the pulse of global crypto happenings, and, most importantly, continuously learn and adapt. After all, in the fast-paced crypto dance, staying nimble is the name of the game.
Peering into the Crystal Ball: The Evolution of Crypto Graph Analysis
Let’s take a moment to appreciate the whirlwind journey of the crypto world. It’s dynamic, ever-changing, and always keeps us on our toes. And as this universe expands and morphs, so does the art and science of crypto graph analysis.
Now, imagine blending the sharpness of artificial intelligence with the intricacies of crypto data. That’s where we’re headed. AI and machine learning are not just buzzwords; they’re set to be game-changers. They’ll dive into data oceans, fishing out patterns and insights that might elude even the sharpest human analysts.
Then there’s the DeFi wave, sweeping across the crypto shores, bringing with it complex transactions and innovative financial mechanisms. As these platforms multiply and diversify, our old analysis tools might seem like blunt instruments. The need of the hour? Sharper, more nuanced analysis methods that can dissect this evolving landscape.
Real-time insights are no longer a luxury; they’re a necessity. The crypto market doesn’t sleep, and neither can our analysis. The hunger for on-the-spot, actionable insights is pushing the growth of platforms emphasizing “crypto graph analysis live.”
And speaking of holistic views, the integration of tools like smart crypto correlation will be a boon. It’s one thing to understand a crypto asset in isolation and another to see it in the grand dance of the market.
To sum it up, the horizon of crypto graph analysis is shimmering with promise. With tech innovations as the wind in its sails, it’s set to journey into uncharted waters, and what an exciting voyage it promises to be!
Final Thoughts
Let’s face it, the crypto universe is vast, complex, and sometimes downright bewildering. But here’s the silver lining: armed with the right tools, like crypto graph analysis, we can chart a clearer path through this digital maze. It’s not just about gut feelings or hunches; it’s about grounding our decisions in solid analysis, understanding past trends, and being alert to real-time shifts. As the crypto world keeps reinventing itself, staying in sync with the latest in analysis techniques is our ticket to staying relevant. The role of crypto graph analysis in guiding our crypto endeavors is undeniable. And if you’re itching for more insights, tips, and a deeper dive into all things crypto, a visit to Forvest’s Blog is a must. It’s like having a seasoned guide by your side, helping you navigate the exhilarating, ever-evolving world of digital currencies.
Rating of this post
Rate
If you enjoyed this article, please rate it.