

Crypto Technical Indicators Explained: A Framework for Understanding Market Conditions
Crypto technical indicators help investors understand market conditions by analyzing historical data such as price movements, trading volume, momentum, and volatility. However, their purpose is not to predict the next cryptocurrency price movement or provide guaranteed trading signals. Instead, these tools help investors interpret market behavior, evaluate changing conditions, and develop a clearer understanding of trends and potential risks.
Many investors initially approach technical indicators expecting a single tool to tell them when to buy, sell, or predict what the market will do next. This misunderstanding often leads to poor interpretation because each indicator focuses on a specific part of market behavior. RSI crypto analysis provides insight into momentum conditions, moving averages help investors evaluate trend structure, MACD highlights changes in momentum, and volatility indicators provide context about changing risk environments.
Forvest approaches crypto technical indicators as decision-support tools rather than prediction systems or automatic trading signals. When combined with fundamental research, portfolio objectives, and disciplined risk management, these tools help investors analyze market conditions more effectively and build a more structured framework for understanding crypto markets.
What Are Crypto Technical Indicators?
Crypto technical indicators are mathematical calculations that analyze historical market information to highlight specific patterns or conditions.
They are commonly built from three types of market data:
- Price movement
- Trading volume
- Market volatility
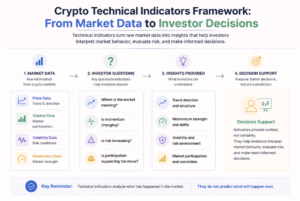
By analyzing this information, indicators help investors evaluate questions such as:
- Is the market trending or moving sideways?
- Is momentum strengthening or weakening?
- Is volatility increasing?
- Are price movements supported by broader market participation?
For example, moving averages analyze previous price data to help investors understand market direction and trend structure. They do not predict whether Bitcoin or another cryptocurrency will rise or fall. Instead, they provide context about how current price behavior compares with historical movement.
Similarly, the Relative Strength Index (RSI) measures momentum conditions by examining recent price changes. An RSI reading does not automatically indicate that an asset should be bought or sold. It helps investors understand whether recent momentum appears unusually strong or weak.
The same principle applies to other commonly used indicators, including MACD, Bollinger Bands, Average True Range (ATR), and volume indicators. Each tool answers a different market question, and none of them provides a complete investment decision by itself.
The biggest mistake investors make is searching for one “perfect” indicator.
Professional investors usually combine different types of information because markets are influenced by multiple factors at the same time.
How Investors Use Technical Indicators in Crypto Markets
Crypto markets create unique challenges compared with traditional financial markets. Digital assets trade continuously, and prices can change quickly due to shifts in liquidity, sentiment, regulation, and broader market conditions.
Technical indicators help investors organize this information by focusing on specific aspects of market behavior.
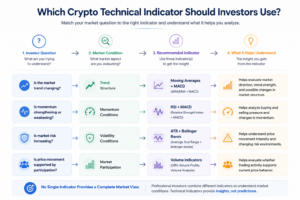
A useful framework is to match the market question with the type of indicator designed to analyze it:
| Investor Question | Indicator Category | Common Examples |
|---|---|---|
| Is the market trend changing? | Trend indicators | Moving averages, MACD |
| Is momentum strengthening or weakening? | Momentum indicators | RSI, Stochastic |
| Is market risk increasing? | Volatility indicators | ATR, Bollinger Bands |
| Is price movement supported by participation? | Volume indicators | OBV, Volume Profile |
This framework is more useful than asking:
“Which indicator is the best?”
because different indicators solve different analytical problems.
For example, an investor studying long-term market direction may focus on trend indicators, while an investor evaluating changing risk conditions may pay more attention to volatility measurements.
The goal is not to collect more indicators. More indicators do not always create better analysis. The goal is to understand which information is relevant for the market condition being evaluated.
What Crypto Technical Indicators Can and Cannot Tell Investors
Technical indicators are valuable because they help investors interpret market behavior, but they have clear limitations.
Technical indicators can provide valuable market context, but understanding their limitations is equally important.
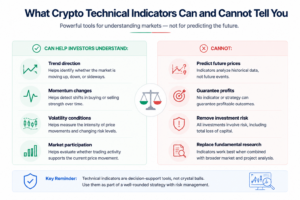
Crypto technical indicators help investors understand market conditions by analyzing trends, momentum, volatility, and participation. However, these tools provide market context rather than guaranteed predictions or investment outcomes.
By recognizing what indicators can and cannot explain, investors can use them as part of a broader market analysis framework.
They can help investors understand:
- Market direction
- Momentum changes
- Volatility conditions
- Market participation
However, indicators cannot predict future prices or remove uncertainty.
Historical market data reflects what has already happened. Future market conditions can change because of factors that charts cannot fully capture, including regulatory developments, macroeconomic events, liquidity changes, and shifts in investor sentiment.
A moving average crossover does not guarantee a new trend.
An extreme RSI reading does not automatically mean a reversal.
Higher volatility does not indicate whether prices will move higher or lower.
This is why professional investors treat technical indicators as analytical context rather than decision-makers.
Technical analysis also does not replace fundamental analysis. Indicators cannot evaluate factors such as technology development, adoption, competitive position, or the long-term value proposition of a crypto asset.
The most effective approach is combining market analysis, fundamental evaluation, and risk management into a broader investment process. For investors managing multiple digital assets, crypto portfolio management can help organize investment decisions, monitor exposure, and maintain a clearer view of overall portfolio conditions.
Understanding what technical indicators measure is the foundation. The next step is exploring how individual tools such as RSI, MACD, moving averages, Bollinger Bands, and volume indicators work, what they reveal about market conditions, and where their limitations appear.
Crypto Technical Indicators Compared: RSI, MACD, Moving Averages & How Investors Use Them
The biggest challenge with crypto technical indicators is not finding more tools. It is understanding which indicator can answer the specific market question an investor is trying to evaluate.
Different indicators measure different aspects of market behavior. Some focus on market direction, while others provide insight into momentum, volatility, or participation. The most effective approach is not collecting as many indicators as possible, but understanding what each tool measures and where its limitations appear.
Professional investors typically use technical indicators as part of a broader framework that combines market analysis, portfolio objectives, risk management, and fundamental research.
No single crypto technical indicator can provide a complete picture of market conditions. Each indicator offers a different perspective, and their value comes from combining relevant information rather than searching for a perfect signal.
Crypto Technical Indicators Comparison Framework
The following comparison shows how the most widely used crypto technical indicators support investor analysis.
| Indicator | Category | What It Measures | Investor Use | Main Limitation |
|---|---|---|---|---|
| RSI (Relative Strength Index) | Momentum | Strength and speed of recent price movements | Evaluate momentum conditions and market extremes | Can remain high or low during strong trends |
| MACD | Trend + Momentum | Relationship between moving averages and momentum changes | Understand momentum shifts and trend strength | Reacts after price changes occur |
| Moving Averages (SMA & EMA) | Trend | Average price direction over time | Identify market structure and trend conditions | Based on historical data |
| Bollinger Bands | Volatility | Price movement relative to volatility ranges | Understand volatility expansion and contraction | Does not determine price direction |
| ATR (Average True Range) | Volatility | Typical market movement range | Evaluate volatility and risk conditions | Does not indicate trend direction |
| Volume Indicators | Market Participation | Strength behind price movements | Assess whether market activity supports a move | Requires broader market context |
Understanding these differences helps investors avoid one of the most common mistakes in technical analysis: treating every indicator as a prediction tool.
The Four Categories of Crypto Technical Indicators
Crypto technical indicators can generally be divided into four major categories: momentum indicators, trend indicators, volatility indicators, and volume indicators. Each category focuses on a different aspect of market behavior and helps investors evaluate specific conditions within the market.
Trend, Momentum, Volatility, and Volume Indicators
Trend indicators help investors understand the broader direction of price movement and whether an asset is developing an upward, downward, or sideways trend.
Momentum indicators focus on the strength and speed behind price changes, helping investors evaluate whether market activity is becoming stronger or weaker.
Volatility indicators provide insight into changing risk conditions by measuring the intensity of market fluctuations.
Volume indicators help investors understand whether market participation supports current price behavior.
Understanding these differences is important because no single indicator can explain every aspect of the market. A momentum indicator cannot replace a trend indicator, and a volatility measurement cannot determine market direction.
The purpose of combining indicators is not to create certainty. Instead, investors use different tools together to build a clearer understanding of current market conditions.
Momentum Indicators: Understanding the Strength of Price Movement
Momentum indicators help investors evaluate how quickly and strongly prices are moving. They provide context about whether market momentum is strengthening, weakening, or changing over time.
The most commonly referenced momentum indicators in crypto markets include RSI and Stochastic Oscillator.
RSI Crypto Explained: Measuring Momentum Conditions
The Relative Strength Index (RSI) is one of the most widely used crypto technical indicators.
RSI measures the relationship between recent gains and losses to evaluate momentum conditions on a scale from 0 to 100. In crypto markets, RSI crypto analysis helps investors understand whether recent price movements show unusually strong or weak momentum compared with historical market behavior.
A higher RSI reading may indicate stronger recent momentum, while a lower RSI reading may indicate weaker momentum. However, RSI should not be interpreted as an automatic buy or sell signal.
One of the most common mistakes in technical analysis is assuming that a high RSI means the price must decline or that a low RSI means the price must increase.
Markets can remain in extreme RSI conditions for extended periods, especially during strong trends. This is why professional investors interpret RSI alongside broader market context rather than relying on the indicator alone.
This broader context may include the overall market trend, timeframe conditions, and other technical indicators.
The value of RSI comes from understanding momentum behavior, not predicting reversals.
Trend Indicators: Understanding Market Direction
Trend indicators help investors evaluate whether an asset is moving upward, downward, or within a range.
Unlike momentum indicators, which focus on the strength of price movement, trend indicators focus on the broader direction of market behavior.
The most common trend indicators include Simple Moving Average (SMA), Exponential Moving Average (EMA), and MACD.
Moving Averages Crypto Explained: Identifying Trend Structure
Moving averages are among the most established technical indicators across financial markets, and moving averages crypto analysis helps investors evaluate trend structure and market direction.
They smooth historical price data to help investors identify broader market direction and understand how current price behavior compares with previous market conditions.
SMA and EMA in Crypto Analysis
Two commonly used forms are:
Simple Moving Average (SMA) calculates the average price over a selected period.
Exponential Moving Average (EMA) gives greater weight to recent price data, making it more responsive to recent market changes.
How Investors Use Moving Averages
Crypto investors commonly analyze moving averages such as the 50-day and 200-day moving averages to evaluate whether current price movement aligns with a broader trend, whether market structure is changing, and whether current conditions differ from historical averages.
However, moving averages are lagging indicators.
They confirm changes after they begin rather than predicting them in advance.
A moving average crossover can provide useful market context, but it does not guarantee that a new trend will continue.
MACD Crypto Explained: Understanding Momentum Changes Within Trends
The Moving Average Convergence Divergence (MACD) is one of the most widely used crypto technical indicators for evaluating changes in momentum within an existing trend.
Unlike indicators that focus only on current price movement, MACD analyzes the relationship between moving averages to help investors understand whether momentum is strengthening, weakening, or changing.
MACD commonly includes three main components:
- MACD line
- Signal line
- Histogram
Together, these components provide insight into the relationship between short-term and longer-term price momentum.
Investors often use MACD to evaluate:
- Changes in momentum strength
- Potential shifts in trend conditions
- Differences between price movement and momentum behavior
For example, if price continues moving higher while momentum begins weakening, MACD may provide additional context that market conditions are changing.
However, MACD relies on historical price data. Like other trend-based indicators, it reacts to market changes rather than predicting them in advance.
The most effective use of MACD comes from combining it with broader market analysis instead of interpreting individual signals in isolation.
Volatility Indicators: Understanding Market Risk
Volatility indicators help investors understand how significantly prices are moving and how market conditions are changing.
Unlike momentum or trend indicators, volatility indicators do not focus on direction. Their purpose is to measure the intensity of price movement and provide additional context about changing risk conditions.
In crypto markets, where price fluctuations can occur quickly, understanding volatility can help investors evaluate whether current conditions represent a calmer environment or a period of increased uncertainty.
Common volatility indicators include Bollinger Bands and Average True Range (ATR).
Bollinger Bands Crypto Explained: Measuring Volatility Conditions
Bollinger Bands are a widely used crypto technical indicator for analyzing price movement relative to volatility levels.
The indicator compares current price behavior with a moving average and volatility range to help investors understand whether market conditions are expanding, contracting, or experiencing unusual movement.
Investors commonly use Bollinger Bands to evaluate:
- Periods of increasing volatility
- Periods of market compression
- Price movement compared with historical volatility conditions
A common misconception is that touching an upper or lower band automatically indicates that a reversal will occur.
This interpretation is incomplete.
During strong trends, prices can remain near one side of the bands for extended periods because volatility and momentum can continue supporting the existing market condition.
Bollinger Bands provide information about volatility behavior, not guaranteed market direction.
ATR Crypto Explained: Measuring Market Movement and Risk
Average True Range (ATR) measures the average size of price movements over a specific period.
Unlike momentum indicators, ATR does not evaluate whether buyers or sellers are stronger. Instead, it helps investors understand the amount of movement currently occurring within the market.
Investors commonly use ATR to evaluate:
- Changes in volatility
- Market stability
- Risk conditions
Higher ATR values indicate larger average price movements, while lower ATR values suggest calmer market conditions.
However, ATR does not predict whether prices will move higher or lower.
Its primary value comes from helping investors understand the current volatility environment and adjust their interpretation of market conditions accordingly.
Volume Indicators: Understanding Market Participation
Volume indicators help investors evaluate the level of activity supporting price movements.
While price shows what happened in the market, volume provides additional context about the level of participation behind that movement.
Common volume indicators used in crypto analysis include:
- On-Balance Volume (OBV)
- Volume Profile
Investors use volume indicators to evaluate whether market activity supports a price movement or whether a move is occurring with limited participation.
For example, a price increase supported by stronger market participation may provide different information compared with a similar move occurring during lower activity.
However, volume should always be interpreted alongside broader market conditions.
High volume does not automatically mean that prices will continue moving in the same direction, and low volume does not always indicate weakness.
Why No Single Crypto Technical Indicator Works Alone
The biggest mistake in technical analysis is searching for one “best” crypto technical indicator that works in every market condition.
Different indicators answer different questions.
Trend indicators help investors understand the broader direction of market behavior, while momentum indicators provide insight into the strength behind price movements. Volatility indicators help evaluate changing risk conditions, and volume indicators provide context about market participation.
A stronger analytical framework combines these perspectives instead of relying on a single measurement.
The goal of technical analysis is not to remove uncertainty from crypto markets. It is to help investors understand market conditions more clearly and evaluate risk with better context.
In the next section, we will explore how investors combine multiple crypto technical indicators responsibly and how these tools fit into a broader portfolio decision framework.
How Investors Combine Crypto Technical Indicators for Better Market Analysis
Crypto technical indicators become more valuable when investors understand how different tools work together rather than relying on one measurement.
Each indicator provides information about a specific part of market behavior. Moving averages can help evaluate broader trends, RSI crypto analysis can provide insight into momentum conditions, MACD can highlight changes in momentum within trends, and volatility indicators can help investors understand changing risk environments.
The purpose of combining indicators is not to create a system that predicts future cryptocurrency prices. Instead, investors use multiple sources of market information to build a more complete understanding of current conditions.
A strong crypto technical analysis approach focuses on asking better questions:
Is the market trend changing?
Is momentum becoming stronger or weaker?
Is volatility increasing?
Is current price movement supported by meaningful participation?
By using indicators in this way, investors move away from searching for a perfect signal and toward building a structured framework for evaluating market behavior.
Combining Crypto Technical Indicators Based on Market Conditions
Different market environments require different types of analysis.
An indicator that provides useful information during a strong trend may become less reliable during a period of high uncertainty or sideways price movement.
For example, moving averages crypto investors often use can provide useful context when markets develop clear trends. However, during periods of rapid price fluctuations, relying only on trend indicators may create an incomplete view of market conditions.
A more balanced framework combines different categories of indicators:
| Market Question | Useful Indicators | What Investors Can Understand |
|---|---|---|
| Is the market trend changing? | Moving Averages, MACD | Direction and trend strength |
| Is momentum increasing or weakening? | RSI, MACD | Changes in buying or selling pressure |
| Is market risk increasing? | Bollinger Bands, ATR | Volatility conditions |
| Is price movement supported by participation? | Volume Indicators | Strength behind market activity |
This approach allows investors to select indicators based on the specific situation they are evaluating rather than using every available tool at the same time.
Why Investors Should Avoid Using One Indicator Alone
One of the most common mistakes in crypto technical analysis is treating a single indicator as a complete decision-making system.
For example, an RSI crypto reading may show that momentum has reached an extreme level, but that information alone does not explain whether a trend will continue or reverse.
A moving average crossover may suggest that market structure is changing, but it does not guarantee that the new direction will continue.
Similarly, increased volatility does not automatically indicate whether prices will move higher or lower.
Technical indicators work best when they provide additional context alongside other forms of analysis.
Professional investors often combine technical information with:
- Fundamental research
- Portfolio objectives
- Risk management principles
- Market conditions
The goal is not to eliminate uncertainty. The goal is to understand uncertainty more effectively.
Crypto Technical Indicators and Fundamental Analysis
Technical indicators focus primarily on market behavior.
They analyze information such as price movement, momentum, volatility, and trading activity. However, they do not evaluate the underlying quality of a cryptocurrency project.
Fundamental analysis considers different factors, including technology, adoption, ecosystem development, competitive position, and long-term market potential.
For investors, combining technical and fundamental perspectives can create a more complete research process.
A cryptocurrency may show strong technical momentum, but investors may still need to evaluate whether the underlying asset aligns with their long-term objectives.
Likewise, a strong project may experience short-term price volatility that requires careful risk evaluation.
Technical indicators are therefore most useful when they support broader investment research rather than replacing it.
Common Mistakes Investors Make When Using Crypto Indicators
Understanding how indicators work is important, but understanding their limitations is equally valuable.
Many mistakes happen when investors interpret indicators without considering market context.
A common example is assuming that an overbought RSI level automatically means a price decline is coming. In reality, strong trends can maintain extreme momentum conditions for extended periods.
Another mistake is combining too many indicators without understanding their purpose.
Adding more indicators does not always create better analysis. In many cases, it creates additional noise and makes it harder to identify the information that actually matters.
A more effective approach is choosing indicators that answer specific questions.
For example:
A trend question may require moving averages.
A momentum question may require RSI or MACD.
A risk question may require volatility indicators.
A participation question may require volume analysis.
The quality of analysis depends less on the number of indicators used and more on the quality of interpretation.
How AI Can Support Crypto Technical Indicator Analysis
As crypto markets generate increasing amounts of data, artificial intelligence is becoming a useful tool for organizing and interpreting market information.
AI-powered systems can help investors summarize indicator conditions, analyze large amounts of market data, and identify patterns that may require further research. For investors managing multiple digital assets, AI crypto portfolio management tools can also help organize portfolio data, monitor portfolio risk, and create a more structured approach to investment analysis.
However, AI should not be viewed as a prediction engine.
AI tools cannot guarantee cryptocurrency price movements or remove investment uncertainty.
The most valuable role of AI in crypto analysis is helping investors process information more efficiently and create a clearer research workflow.
When combined with human judgment, risk management, and fundamental analysis, AI can support a more structured approach to understanding crypto markets.
A Practical Framework for Using Crypto Technical Indicators
A useful way to approach crypto technical indicators is to begin with the market question rather than the indicator itself.
Instead of asking:
“Which is the best crypto technical indicator?”
Investors can ask:
“What information do I need to understand about the current market?”
This change in perspective creates a more disciplined analytical process.
Technical indicators are not designed to predict every market movement. Their value comes from helping investors understand trends, momentum, volatility, and participation within a constantly changing environment. Effective crypto risk management helps investors combine market analysis with position sizing, risk awareness, and disciplined decision-making.
Forvest’s approach focuses on using these tools as part of a broader investment intelligence framework — helping investors interpret market conditions, evaluate risk, and make more informed decisions.
Final Thoughts
Crypto technical indicators are most effective when investors understand what each tool measures, where it provides value, and where its limitations appear.
RSI crypto analysis, MACD, moving averages crypto strategies, volatility indicators, and volume analysis each provide different perspectives on market behavior.
The goal is not to find one perfect indicator.
The goal is to develop a clearer framework for understanding market conditions and evaluating risk with better context.
By combining technical analysis with fundamental research and disciplined portfolio management, investors can use crypto indicators as part of a more informed decision-making process.
Cryptocurrency markets involve significant uncertainty and risks, including market volatility, liquidity changes, and other factors that investors should carefully evaluate. Understanding digital asset risks is an important part of developing a responsible approach to crypto market analysis.
Disclaimer
Crypto technical indicators are analytical tools designed to help investors better understand market conditions, price behavior, momentum, volatility, and risk factors. They are not designed to predict future cryptocurrency prices, provide guaranteed trading outcomes, or replace independent research and professional financial judgment.
Cryptocurrency markets are highly volatile and involve significant risks. Investors should consider their personal financial circumstances, investment objectives, and risk tolerance before making any investment decisions. Technical indicators should be used as part of a broader research process that includes appropriate risk management and careful evaluation of market conditions.