
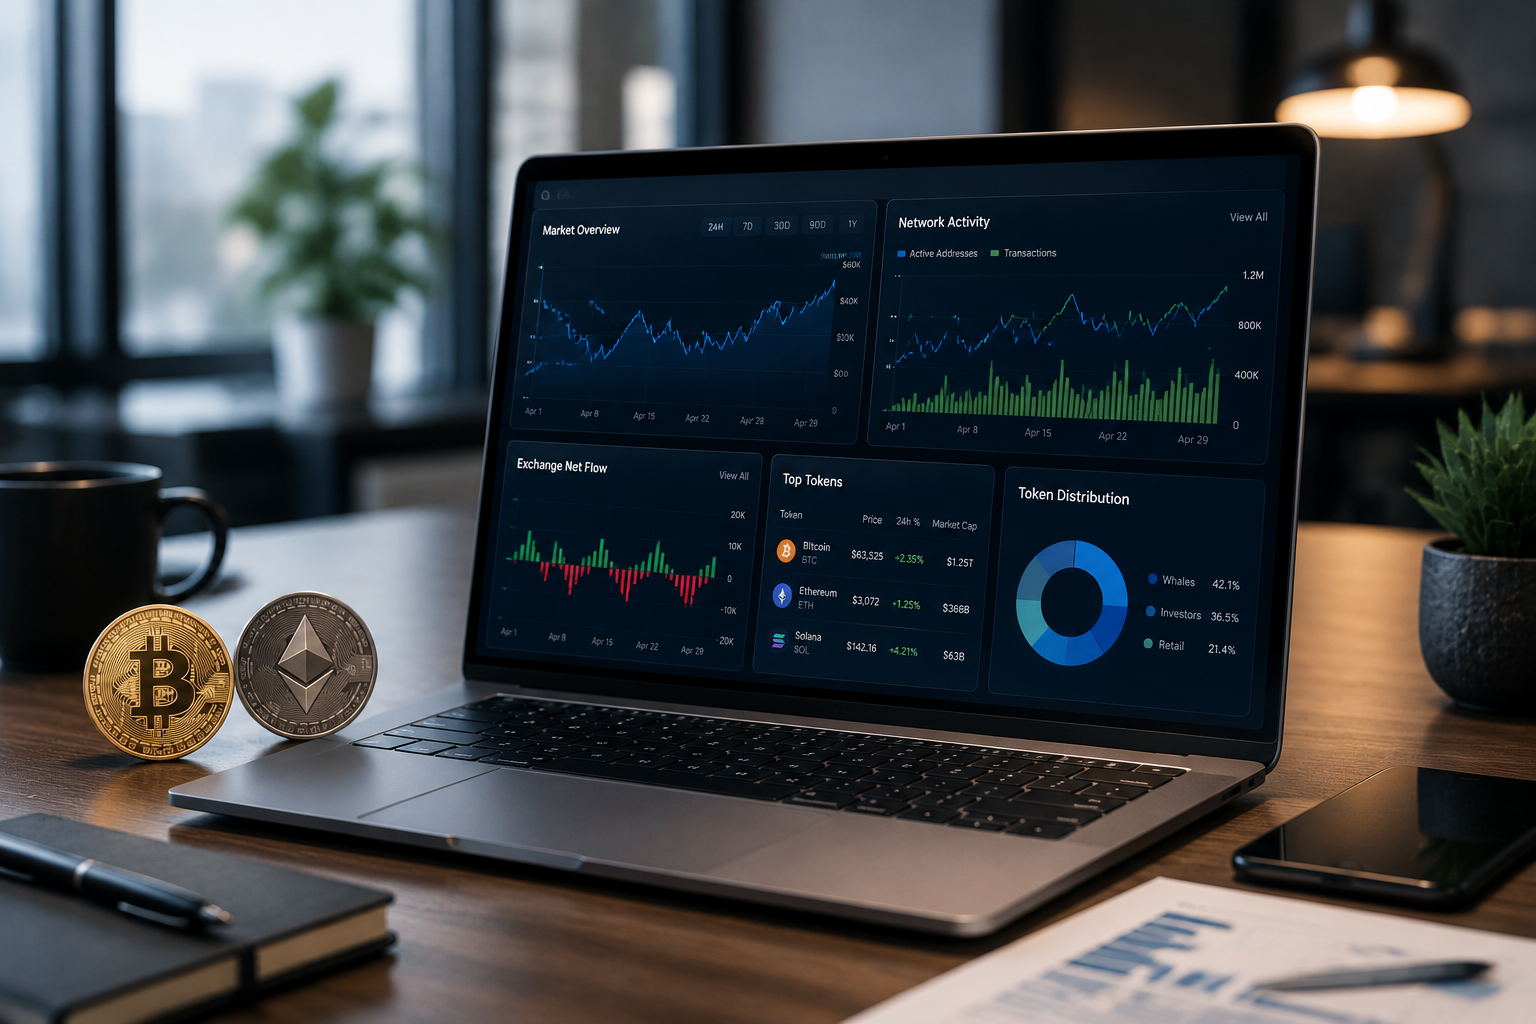
Crypto analytics is the process of turning market, blockchain, project and portfolio data into evidence for an investment decision. It does not remove uncertainty or predict a guaranteed outcome. Its value is simpler: it helps an investor replace a vague story with questions that can be checked.
For a beginner with a long-term horizon, the goal is not to monitor every chart. It is to collect a small set of relevant signals, understand where each signal came from, compare supporting and conflicting evidence, and decide whether an asset fits a predefined risk budget.
This guide explains the four main layers of cryptocurrency analytics, the metrics that matter most, a repeatable research workflow and the limitations that should appear in every research note.
What Is Crypto Analytics?
Crypto analytics combines data from several sources to answer an investment question. Market data describes price, volume and liquidity. On-chain data records activity on a blockchain. Project data covers the product, token design, governance, team and security. Portfolio data shows what the asset would do to an investor’s overall concentration and risk.
Raw data is not a conclusion. For example, rising transaction volume can reflect genuine adoption, speculation, internal transfers, spam or a one-time event. An analyst must ask what the metric measures, what it misses and whether another source supports the same interpretation.
| Stage | Beginner question | Useful output |
|---|---|---|
| Data | What was measured, by whom and at what time? | A dated source with a clear definition |
| Interpretation | What could explain the change? | At least one supporting and one conflicting explanation |
| Decision | Does this change my risk, allocation or review plan? | A written action or a decision to wait |
| Validation | What new evidence would prove this view wrong? | A measurable review trigger |
This distinction is important because a dashboard can display accurate numbers while a user still reaches an unsupported conclusion. Good crypto research documents both the metric and the reasoning that connects it to a decision.
The Four Layers of Crypto Analytics
No single layer is sufficient. A liquid asset can still have weak token economics. A busy network can still be overvalued. A strong project can still be unsuitable for a concentrated portfolio. The four layers answer different questions and should be reviewed together.
| Analytics layer | What it examines | Best use | Main limitation |
|---|---|---|---|
| Market | Price, volume, spreads, order-book depth, volatility and market structure | Assessing tradability and current market conditions | Reported activity can be fragmented, delayed or distorted |
| On-chain | Transactions, addresses, fees, supply movement, validators and smart-contract activity | Observing network behavior and asset flows | An address is not necessarily one user, and labels can be incomplete |
| Project | Use case, team, code, security, tokenomics, governance, roadmap and adoption | Testing the long-term investment thesis | Disclosures may be selective and future plans may not happen |
| Portfolio and risk | Allocation, concentration, correlation, drawdown, liquidity needs and custody exposure | Deciding whether the asset fits the investor | Historical relationships can change |
1. Market analytics
Market analytics studies how an asset trades. Price shows the latest agreement between buyers and sellers, but price alone says little about market quality. Volume, spread and order-book depth help answer whether a position can be entered or exited without a large price impact.
Aggregated prices are constructed from exchange-level tickers rather than taken from one universal market. For example, CoinGecko’s published price aggregation methodology describes source conversion, stale-ticker filters, outlier removal and volume-weighted aggregation. That is why two reputable data services can show slightly different prices at the same moment.
Use a broader crypto market analysis framework when the decision depends on liquidity, volatility or market regime rather than one project alone.
2. On-chain analytics
On-chain analytics examines records written to a blockchain: blocks, transactions, accounts, fees, validators, token transfers and smart-contract events. Ethereum’s official data and analytics documentation explains that explorers and APIs provide access to blocks, transactions, validators, accounts and other on-chain activity.
These records are observable, but their meaning is not always obvious. One exchange can control many addresses, one user can control several wallets, and a large transfer can be an internal reorganization rather than a buy or sell. Treat wallet labels and behavioral categories as estimates unless the owner has verified them.
3. Project and fundamental analytics
Project analytics asks whether an asset has a credible reason to exist and whether value can reach the token. Review the official documentation, product usage, security history, code and upgrade process, token supply, unlock schedule, governance, treasury, team transparency and competitive position.
A structured crypto due diligence process prevents a polished website or active community from becoming a substitute for evidence. The crypto project analysis behind a Trust Score can organize risk signals, but a headline score should lead to the underlying evidence, not end the investigation.
4. Portfolio and risk analytics
An asset can look attractive in isolation and still be a poor addition to a portfolio. Portfolio analytics examines position size, total crypto exposure, concentration by theme or network, correlation with existing holdings, historical drawdowns and the investor’s need for liquidity.
Long-term investors should define the maximum loss they can tolerate before choosing a position size. FINRA notes that crypto assets can be extremely volatile and less liquid than traditional instruments, and that loss of the entire investment is possible. Its crypto-asset risk guidance also emphasizes allocation and diversification as core risk-management principles.
Use a crypto portfolio management framework to connect project-level research with allocation, monitoring and rebalancing rules.
Crypto Metrics Beginners Should Understand
The best metric is the one that answers a specific question. Beginners usually need a compact set of interpretable measures rather than dozens of indicators.
| Metric | Question it can help answer | Important caution |
|---|---|---|
| Market capitalization | How large is the circulating asset value relative to alternatives? | It does not measure liquidity or total capital invested |
| Trading volume | How much reported trading activity occurred in a period? | Reported volume can be inflated; compare venues and methodology |
| Spread and depth | How costly could it be to enter or exit a position? | Liquidity can disappear during stress |
| Volatility and drawdown | How widely has price moved, and how severe were past declines? | Past ranges do not cap future losses |
| Active addresses and transactions | Is observable network activity changing? | Addresses are not the same as unique people |
| Fees and protocol revenue | Are users paying for block space or a service? | Incentives or temporary congestion can distort the signal |
| Circulating supply and unlocks | Could future issuance change ownership or selling pressure? | Schedules can change and circulating-supply estimates can differ |
| Holder concentration | How much supply is controlled by large addresses? | Exchange, bridge and treasury wallets require separate treatment |
| Portfolio weight and correlation | Does the asset add diversification or repeat an existing risk? | Correlation is unstable and often rises during market stress |
Never interpret a percentage without a denominator, a time window and a comparison. A 20% rise in activity may be meaningful from a stable base or meaningless after a short-lived collapse. Record the absolute value, period and source alongside the percentage change.
A Beginner’s Crypto Research Workflow
- Define the decision. Write the asset, intended holding period, maximum position size and the question you are trying to answer. “Should I allocate up to 2% for three years?” is more useful than “Will this coin go up?”
- Verify the asset. Confirm the official website, contract address, network and documentation. Impersonation and similarly named tokens are common risks.
- Check market quality. Review price across more than one venue, recent volume, spread, depth and major listing concentration. Record the timestamp and base currency.
- Review the project. Read primary documentation and look for a working product, clear token utility, supply schedule, security disclosures, governance process and evidence of development. Separate completed facts from roadmap claims.
- Add on-chain context. Select only metrics connected to the thesis. For a payment network that may be transaction activity and fees; for a staking network it may include validator participation and stake concentration.
- Test portfolio fit. Estimate the effect on total crypto exposure, theme concentration, liquidity and maximum loss. A strong thesis does not justify an unlimited allocation.
- Write the contrary case. List at least two facts that would weaken the thesis and the date you will review them again. If no observable evidence could change your mind, the process is belief, not analysis.
Complete these steps in the same order each time. A consistent process makes two projects comparable and reduces the temptation to search only for evidence that supports an initial preference.
Worked Example: A Dated Research Note
The following fictional example shows how to document evidence. The numbers are illustrative, not current market data or an investment recommendation.
Research snapshot: Project X, recorded 10 August 2026 at 12:00 UTC. Decision under review: whether the asset qualifies for a maximum 1% experimental allocation with a two-year horizon.
| Observation | Recorded snapshot | Provenance and latency | Interpretation and next check |
|---|---|---|---|
| Market quality | $240m circulating market cap; $8m reported 24-hour volume | Aggregator snapshot; prices combined across venues and subject to refresh delay | Activity appears measurable, but order-book depth must be checked before sizing |
| Network activity | 14-day median active addresses 18% above the prior 14-day median | Explorer/API query captured at the stated time; address labels incomplete | Supports an activity increase, not proof of user growth or future price |
| Supply | 5% of current circulating supply scheduled to unlock within 45 days | Official token schedule; confirm whether governance can amend it | Potential dilution and liquidity event; review recipients and historical behavior |
| Concentration | Top ten non-exchange addresses hold 41% of circulating supply | Explorer labels plus manual exclusions; ownership attribution uncertain | Concentration risk remains; verify treasury, vesting and custody addresses |
| Portfolio fit | Existing holdings already have high exposure to the same network theme | Investor’s own portfolio snapshot | New position adds less diversification than the project analysis suggests |
The note contains supporting evidence, conflicting evidence and uncertainty. A reasonable result may be “wait for the unlock and recheck liquidity,” not a forced buy-or-reject answer. Good analytics improves the quality of a decision even when the decision is to do nothing.
How to Evaluate Crypto Research Tools
A useful tool should make evidence easier to verify. Evaluate the research process behind the dashboard, not its visual complexity or the number of metrics it displays.
- Provenance: Does the provider name its exchanges, chains, APIs or primary documents?
- Definitions: Is each metric defined, including units, exclusions and calculation window?
- Freshness: Is there a timestamp, refresh schedule or warning for delayed data?
- Methodology: Does the provider explain aggregation, labeling, missing values and revisions?
- Coverage: Which chains, venues, assets and historical periods are included or excluded?
- Reproducibility: Can you inspect the underlying records, export data or confirm a sample independently?
- Security and privacy: Does the tool require an account, wallet signature or exchange API access? Request the minimum permission required and avoid sharing seed phrases or private keys.
- Decision fit: Does the tool answer your long-term research question, or is it optimized for short-term alerts and trading activity?
Official methodology matters because common labels can hide different calculations. CoinMarketCap, for example, directs users to its market-data and ranking methodology. A metric without a definition should be treated as a lead for further research, not as evidence.
Data Quality, Freshness and Analytical Limits
Every crypto dataset is a partial model of reality. Record these limitations explicitly:
- Fragmentation: Crypto trades across many centralized and decentralized venues, so price and volume depend on source coverage.
- Latency: “Real time” can still include collection, indexing and display delays. A fast-moving market may change before a dashboard refreshes.
- Label uncertainty: Wallet ownership and exchange-flow categories can be incomplete or revised.
- Metric construction: Circulating supply, diluted valuation, active users and protocol revenue may be defined differently by different providers.
- Manipulation: Wash trading, low-liquidity price moves, Sybil activity and coordinated social campaigns can create false signals.
- Historical bias: Backtests may exclude failed assets, use data unavailable at the time or fit parameters too closely to the past.
- Changing relationships: Correlations, market regimes and user behavior can change; a signal that worked previously may fail.
- Missing context: A clean dataset may not capture a security incident, governance dispute, regulatory event or key-person risk.
Artificial intelligence can summarize data and identify patterns, but it inherits the same source, timing and interpretation problems. Treat any forecast as a scenario that needs validation. The separate guide to AI crypto prediction limitations explains why model output should not be treated as certainty.
Turn Analytics Into a Decision, Not a Score Hunt
Do not average unrelated metrics into a homemade score unless the weighting and failure rules are justified. A severe security or liquidity problem should not disappear because several weaker indicators look positive.
A simple decision log is often more useful:
| Decision area | Pass condition | Watch condition | Fail condition |
|---|---|---|---|
| Project evidence | Working product and verifiable documentation | Important adoption or roadmap claims remain unverified | Core claims conflict with primary sources |
| Market quality | Position can be entered and exited within the risk plan | Liquidity is concentrated or unstable | Reliable pricing or exit liquidity cannot be established |
| Security and governance | Controls, incidents and upgrade authority are documented | Material centralization or unresolved incident | Critical undisclosed control or unacceptable custody risk |
| Portfolio fit | Allocation stays within the loss budget | Theme concentration is high | Position would breach the investor’s risk limit |
The outcome can be invest, reject, wait for evidence or monitor without allocating. Record the reason, position limit, invalidation conditions and next review date. This turns a dashboard session into an auditable process.
Common Crypto Analytics Mistakes
- Starting with a price prediction instead of a decision question.
- Treating market capitalization as the amount of cash invested in a token.
- Assuming reported volume equals executable liquidity.
- Calling every address a unique user.
- Using a percentage change without its absolute base and time window.
- Ignoring token unlocks, treasury wallets or bridge addresses in concentration analysis.
- Accepting a dashboard label without reading its methodology.
- Collecting only evidence that supports the original thesis.
- Letting a project score override a critical security, custody or portfolio constraint.
- Failing to save the data timestamp and next review trigger.
Next Step: Build a Repeatable Research Record
Begin with one project and one decision. Record the source and time for each metric, separate facts from interpretations, write the strongest contrary case and check portfolio fit before allocating.
You can start with Forvest Trust Score to organize project-level risk signals. Then inspect the evidence behind the result, add market and on-chain context, and document the maximum position size and review conditions. No metric or score can guarantee safety or returns; the purpose is to make uncertainty visible before capital is committed.
Related reading: Related Forvest guides: crypto analysis tools for different research questions.