

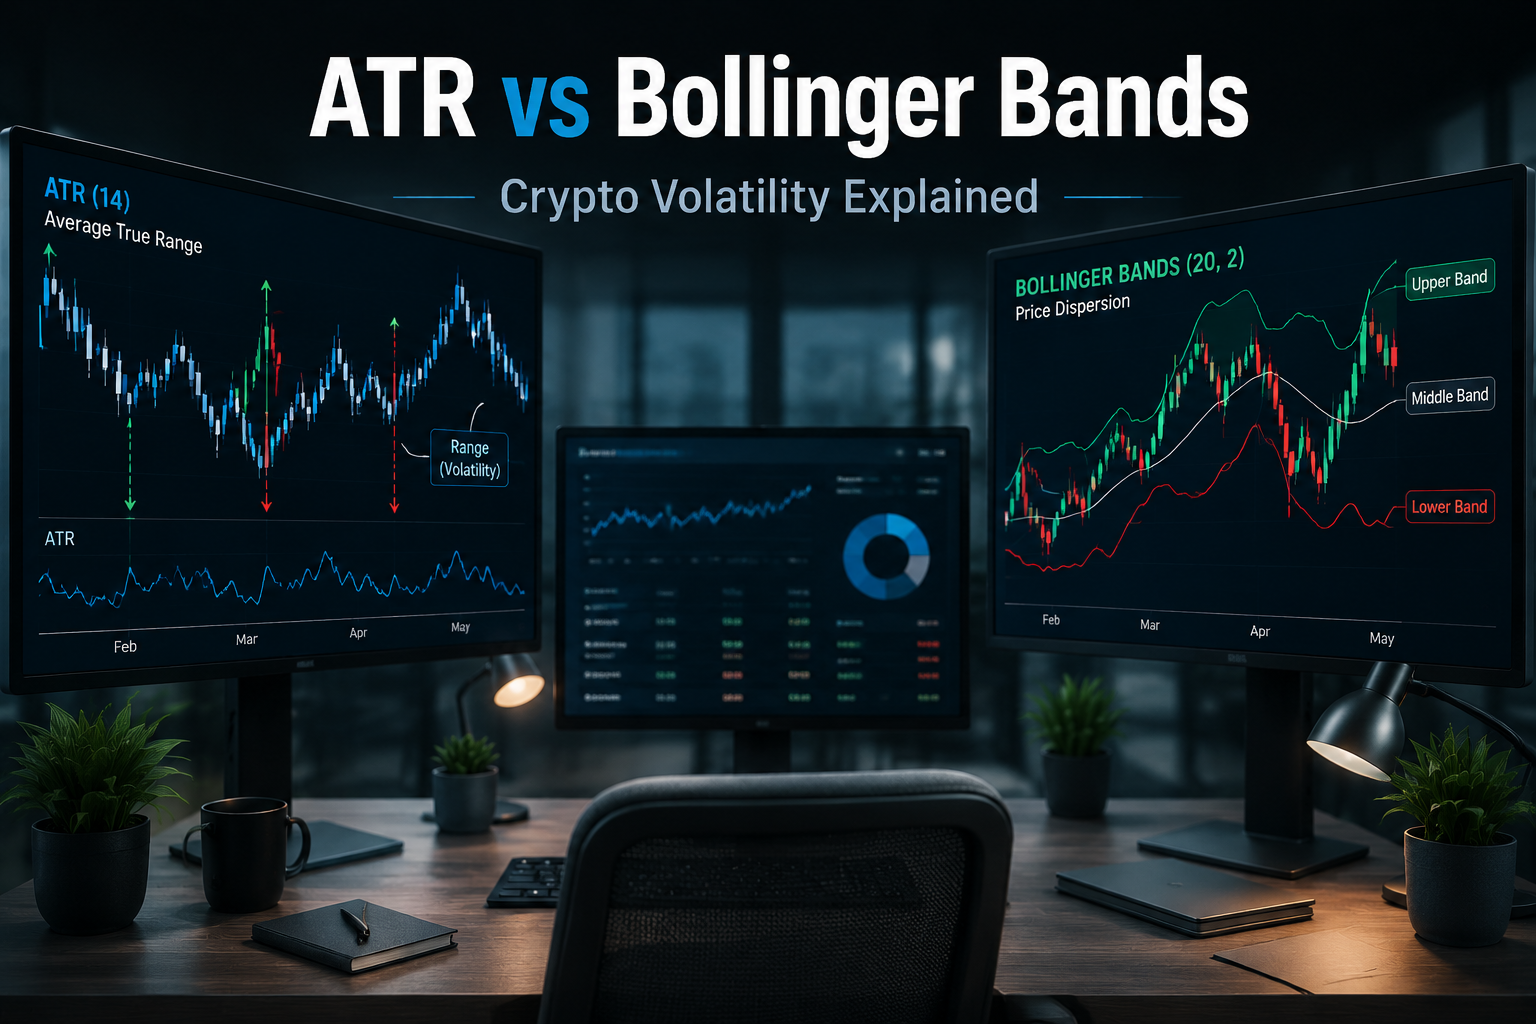
What Does ATR Measure Compared with Bollinger Bands?
Average True Range (ATR) and Bollinger Bands both measure market volatility, but they answer different analytical questions. Although that description is technically accurate, investors often confuse what each indicator actually measures.
The two indicators measure different aspects of market behavior.
ATR measures how much price has moved over a selected period, while Bollinger Bands measure how widely prices move around a moving average. Understanding this distinction helps investors evaluate market conditions without assuming either indicator can predict future price direction.
Although both indicators respond to changing volatility, each answers a different analytical question.
ATR focuses on the magnitude of recent price movement. Bollinger Bands focus on the statistical dispersion of prices around their recent average. Investors often use Average True Range Percentage (ATRP) to normalize ATR across assets with different price levels, while Bollinger Band Width (BBW) provides a standardized way to compare changes in band width over time. For that reason, investors often use these measurements together instead of treating ATR and Bollinger Bands as competing indicators.
Crypto investors face an additional challenge. Digital assets trade across multiple exchanges, liquidity conditions change rapidly, and volatility shifts from one market environment to another. Understanding broader crypto market volatility helps investors interpret indicator readings with better context and avoid drawing incorrect conclusions about market behavior.
This guide compares ATR and Bollinger Bands from an investor’s perspective instead of presenting them as trading signals. Rather than asking which indicator is better, investors should ask a more practical question:
What does each indicator measure, what are its limitations, and when does each provide more meaningful information?
Answering those questions first allows investors to interpret volatility with greater context instead of relying on isolated indicator readings.
Why Comparing ATR and Bollinger Bands Matters
Many educational articles explain ATR and Bollinger Bands separately. As a result, investors often understand how each indicator works but still struggle to decide when they should use one instead of the other.
Crypto markets make that decision even more important.
Bitcoin, Ethereum, and other digital assets regularly experience rapid shifts in volatility, liquidity, and trading activity. For investors analyzing specific assets, reviewing broader Bitcoin market analysis can provide additional context beyond volatility indicators alone.
For that reason, comparing ATR and Bollinger Bands provides more value than studying either indicator in isolation.
Instead of treating both as interchangeable volatility indicators, investors can evaluate the unique information each one contributes.
For example:
- ATR helps investors quantify how far prices have moved over a recent period, making it useful for evaluating historical price range expansion or contraction.
- Bollinger Bands help investors visualize how prices spread around a moving average, providing additional context for changing market volatility.
Neither indicator tells investors whether Bitcoin, Ethereum, or another cryptocurrency will move higher or lower.
Instead, both indicators describe different characteristics of historical market behavior.
Recognizing that distinction helps investors avoid one of the most common mistakes in crypto technical analysis: confusing volatility measurement with price prediction.
Throughout this guide, we treat ATR and Bollinger Bands as complementary analytical tools rather than competing indicators.
What This Guide Covers
This guide focuses on market analysis instead of trading strategies or fixed indicator settings.
It explains:
- what ATR measures—and what it does not measure;
- how Bollinger Bands evaluate market volatility differently;
- why investors should not compare raw ATR values across different assets;
- how Average True Range Percentage (ATRP) and Bollinger Band Width (BBW) improve cross-asset analysis;
- how exchange selection, trading pairs, timeframe, and liquidity influence indicator readings; and
- why investors should evaluate volatility separately from market direction and overall investment risk.
By the end of this guide, you will understand the key differences between ATR and Bollinger Bands. More importantly, you will know when combining both indicators provides more useful market context than relying on either indicator alone.
What Does ATR Measure Compared with Bollinger Bands?
Although both Average True Range (ATR) and Bollinger Bands respond to changes in market volatility, they measure different characteristics of price behavior. Investors who understand this distinction can evaluate market conditions more accurately and avoid using the two indicators interchangeably.
ATR measures the average magnitude of historical price movement over a selected period. Its calculation uses the True Range, which captures the largest movement between the current high, current low, and previous closing price. As a result, ATR reflects how much prices have moved, regardless of whether the market has trended upward or downward.
Bollinger Bands approach volatility from a different perspective. Instead of measuring price movement directly, they calculate how widely prices disperse around a moving average using standard deviation. When prices fluctuate within a narrow range, the bands contract. As volatility increases, the bands expand.
Neither indicator predicts future price direction.
A rising ATR simply shows that price swings have become larger. Expanding Bollinger Bands only indicate that price dispersion has increased. Investors should therefore interpret both indicators as measurements of historical market behavior rather than forecasting tools.
The following comparison summarizes the primary differences between the two indicators.
ATR vs. Bollinger Bands at a Glance
| Feature | Average True Range (ATR) | Bollinger Bands |
|---|---|---|
| Primary Measurement | Historical price movement | Statistical price dispersion |
| Calculation Basis | Average True Range (True Range) | Standard deviation around a moving average |
| Shows Market Direction? | No | No |
| Primary Purpose | Measure the magnitude of price movement | Visualize volatility expansion and contraction |
| Best Use Case | Evaluating recent trading range | Monitoring changes in market volatility |
| Cross-Asset Comparison | Raw ATR values require normalization (ATRP) | Band Width (BBW) provides better relative comparison |
| Main Limitation | Absolute values depend on asset price | Results depend on timeframe and indicator settings |
Although this comparison appears straightforward, investors often misunderstand one important point.
Raw ATR values cannot be compared directly across assets with different price levels. For example, an ATR reading of $2,000 may represent normal volatility for Bitcoin but would be meaningless for Ethereum or Solana. Investors typically use Average True Range Percentage (ATRP) to normalize ATR relative to price and make cross-asset comparisons more meaningful.
Bollinger Bands present a similar challenge. Wide bands do not always indicate unusually high volatility because band width also depends on the selected timeframe, moving average, and standard deviation settings. Many analysts therefore use Bollinger Band Width (BBW) instead of visually estimating whether the bands appear “wide” or “narrow.”
Understanding these differences creates a stronger foundation for interpreting both indicators correctly. The next section explains how ATR calculates market volatility and why its formula measures price movement rather than trend direction.
How ATR Calculates Market Volatility
Average True Range (ATR), introduced by J. Welles Wilder as part of his technical analysis work, measures the magnitude of historical price movement over a selected period. Unlike indicators that attempt to identify trend direction or momentum, ATR focuses only on how much prices have moved.
To understand ATR correctly, investors must first understand the concept of True Range (TR). ATR smooths consecutive True Range values over a selected period. Most charting platforms use 14 periods as a common default, although smoothing methods and configurable settings can vary between platforms. Fidelity describes ATR as the average of True Range values over a specified period and identifies 14 periods as a typical setting. TradingView generally applies a Relative Moving Average but allows alternative smoothing methods.
What Is True Range?
Financial markets can experience rapid price movements that a simple current-high-minus-current-low calculation does not fully capture. In session-based markets, gaps between trading sessions contribute to this difference. Cryptocurrency markets trade continuously, so traditional overnight session gaps occur less frequently. However, comparing each candle with the previous closing price can still capture substantial movement between consecutive periods.
True Range addresses this issue by selecting the largest value from three calculations:
- the difference between the current high and current low;
- the absolute distance between the current high and previous closing price; or
- the absolute distance between the current low and previous closing price.
True Range Formula
TR = Maximum of:
Current High − Current Low
|Current High − Previous Close|
|Current Low − Previous Close|
This formula follows the standard True Range methodology documented by Fidelity and TradingView.
ATR then smooths those True Range values over the selected period. A common 14-period calculation incorporates the latest True Range with previously smoothed ATR data, although implementation details may differ across platforms. Investors should therefore check the indicator methodology and settings used by their chosen charting or data provider.
Because True Range considers the previous close as well as the current high-low range, it can capture historical movement that a simple candle range may omit. Importantly, ATR measures only the size of that movement. It does not indicate whether buyers or sellers controlled the market during the period.
Why ATR Measures Volatility Instead of Direction
One of the most common misconceptions is that a rising ATR automatically signals a bullish market, while a falling ATR indicates bearish conditions.
ATR does not support either conclusion.
A rising ATR indicates that price movements have become larger than before. Those larger movements can occur during strong upward trends, sharp market declines, or uncertain periods with rapid movement in both directions.
Likewise, a declining ATR does not imply that prices will reverse or that a trend has weakened. It only indicates that the average True Range has narrowed compared with previous periods.
For this reason, investors should interpret ATR as a volatility measurement rather than a directional indicator. Fidelity and TradingView both describe ATR as non-directional: it measures the magnitude of movement without showing whether price will rise or fall.
Separating these concepts helps investors avoid confusing increased market activity with a bullish or bearish signal.
Why ATR Changes Across Different Timeframes
ATR values depend on the selected chart timeframe.
A 14-period ATR calculated on a one-hour chart measures average True Range across fourteen hourly candles. The same setting on a daily chart evaluates fourteen daily periods instead. Fidelity notes that ATR periods can be intraday, daily, weekly, or monthly, depending on the timeframe selected.
Higher-timeframe candles often contain broader price ranges than shorter intervals, so their ATR readings may also appear larger. However, the exact relationship depends on the asset, selected market data, volatility conditions, and observation period.
This difference means investors should not compare ATR readings from separate timeframes as though they describe identical conditions. A daily ATR and a four-hour ATR answer different questions, even when both refer to the same cryptocurrency and calendar period.
Maintaining a consistent timeframe creates a more reliable basis for evaluating whether recent price ranges have expanded or contracted.
Why Raw ATR Cannot Be Compared Across Different Assets
Raw ATR values also depend on the price units of the underlying asset.
For example, Bitcoin may produce an ATR measured in thousands of dollars because Bitcoin trades at a much higher nominal price than many other cryptocurrencies. Ethereum may produce a smaller dollar value, while lower-priced assets such as Solana may generate smaller numerical readings still.
Those differences do not necessarily mean one asset has greater relative volatility.
Instead, they may primarily reflect differences in absolute price levels.
Comparing raw ATR values across assets can therefore produce misleading conclusions. ATR reports movement in the asset’s quoted units rather than as a percentage of its price.
To support more meaningful cross-asset comparisons, investors can normalize ATR relative to the asset’s closing price. This percentage expression is commonly called Average True Range Percentage, ATR Percentage, or ATRP. TradingView defines ATR% as the percentage expression of ATR relative to price.
ATRP = ATR ÷ Closing Price × 100
ATRP expresses historical range magnitude as a percentage instead of an absolute price movement. This normalization makes it easier to compare assets with substantially different prices, although investors must still use consistent timeframes, calculation settings, and data sources.
The following section examines ATRP in greater detail and explains its remaining limitations.
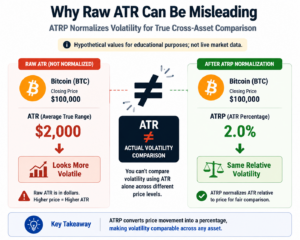
At first glance, Bitcoin appears far more volatile because its raw ATR is numerically larger than the readings for Ethereum and Solana.
That conclusion ignores each asset’s closing price.
After normalization, all three assets produce the same approximate ATRP. The example illustrates why raw dollar values do not provide a reliable cross-asset comparison by themselves. Percentage-based normalization offers a more consistent basis for comparing historical movement across assets with different nominal prices.
Key Takeaways
ATR measures the average magnitude of historical price movement by smoothing True Range values over a selected period. Because it focuses on movement size, ATR cannot identify trend direction or predict future market movements.
Its readings also depend on the selected timeframe, calculation method, data source, and asset price. Investors should therefore avoid comparing raw ATR values across different cryptocurrencies or chart intervals without consistent context.
ATRP addresses one limitation by expressing ATR as a percentage of price, allowing more meaningful comparisons between differently priced assets. The next section examines ATRP in detail before returning to Bollinger Bands and explaining how both indicators contribute different information to volatility analysis.
How Bollinger Bands Measure Volatility Differently
Bollinger Bands measure volatility by showing how widely prices disperse around a moving average. A commonly referenced configuration uses a 20-period simple moving average as the middle band, with upper and lower bands positioned two standard deviations above and below it. This configuration is widely used in Bollinger Band analysis, although settings may vary depending on the analytical objective and market conditions.
When price dispersion decreases, the bands contract. When dispersion increases, they expand. This visual movement helps investors observe changes in volatility without assuming that wider or narrower bands predict the next price direction.
A narrow band structure does not automatically signal low investment risk. It only shows that recent prices have remained relatively close to their moving average under the selected settings. Liquidity, leverage, project-specific events, custody risks, and market concentration may still create substantial exposure.
Similarly, a price touching an upper or lower Bollinger Band does not automatically indicate a reversal. During a strong trend, price may remain close to one band for an extended period. Investors sometimes call this behavior a “band walk.” The band shows where price sits relative to recent dispersion, not whether the market must reverse.
Bollinger Band Width
Investors can measure band expansion and contraction more consistently with Bollinger Band Width (BBW) instead of relying only on visual judgment.
A common expression is:
BBW = (Upper Band − Lower Band) ÷ Middle Band × 100
This BBW calculation expresses the relative width of Bollinger Bands compared with the middle moving average. The methodology is commonly used in Bollinger Band Width analysis.
This calculation represents the relative distance between the upper and lower Bollinger Bands compared with the middle moving average. The formula is commonly used to evaluate changes in band width while keeping the measurement relative to the underlying price structure.
BBW expresses the distance between the upper and lower bands relative to the middle moving average. A higher reading indicates wider dispersion, while a lower reading indicates narrower dispersion under the selected settings.
However, BBW values remain sensitive to the asset, timeframe, lookback period, and standard-deviation multiplier. Investors should compare BBW readings only when those inputs remain consistent.
ATRP vs Bollinger Band Width
Average True Range Percentage and Bollinger Band Width both normalize volatility-related measurements, but they do not measure the same thing.
ATRP expresses recent True Range relative to an asset’s price. It answers:
How large have recent price ranges been compared with the asset’s current value?
BBW expresses the distance between the Bollinger Bands relative to the middle moving average. It answers:
How widely have prices dispersed around their recent average?
This distinction matters because ATRP can rise when candles develop larger ranges, while BBW responds to changes in price dispersion around the moving average. The two measurements may move together during a volatility expansion, but they do not always change at the same speed or by the same amount.
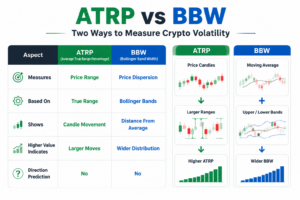
Neither metric reveals whether the next move will be upward or downward.
How ATR and Bollinger Bands Work Together
ATR and Bollinger Bands can provide complementary volatility context because each describes a different feature of historical price behavior.
Bollinger Bands offer a visual view of compression and expansion. ATR provides a numerical measure of recent range magnitude. ATRP adds relative scale, while BBW measures normalized band dispersion.
For example, contracting Bollinger Bands and declining ATR may indicate that recent price activity has become quieter. Expanding bands alongside rising ATR may indicate that both dispersion and candle ranges have increased.
These observations do not confirm a breakout, trend continuation, or reversal. They only describe a change in volatility conditions.
Investors still need additional context, including:
- the selected timeframe;
- market structure;
- trading volume;
- liquidity;
- broader market conditions; and
- the asset’s fundamental and portfolio risks.
Understanding these factors is essential because volatility measurements do not represent total exposure or investment risk. Investors can use broader crypto risk management frameworks to evaluate how volatility fits within overall portfolio decisions.
How Crypto Data Can Change Indicator Readings
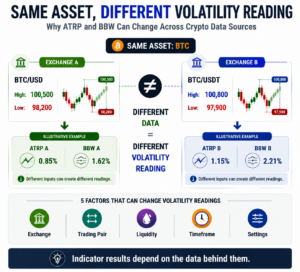
Crypto assets trade across multiple exchanges and pairs. As a result, ATR and Bollinger Band readings may differ even when analysts examine the same cryptocurrency.
| Source of Variation | Possible Effect | Why It Matters |
|---|---|---|
| Exchange | Different highs, lows, closes, and wicks | Indicator values may vary across venues |
| Trading pair | USD, USDT, and other quote assets can produce different price data | Pair selection affects the underlying dataset |
| Timeframe | Different candle intervals change ranges and dispersion | Readings from separate timeframes are not directly comparable |
| Liquidity | Thin order books may create larger wicks or unstable prices | Apparent volatility may reflect market depth |
| Indicator settings | Different lookback periods or multipliers change calculations | Users must compare readings under consistent settings |
These differences do not make the indicators unreliable. They show why investors need transparent and consistent data inputs.
The Forvest Volatility Context Framework
Forvest uses a five-step framework to interpret ATR and Bollinger Bands without turning them into trading signals.
1. Observe
Identify whether Bollinger Bands are contracting, expanding, or remaining relatively stable. This step describes the visual volatility environment.
2. Measure
Review ATR, ATRP, or BBW under consistent settings. Numerical measurements can help determine whether recent ranges or dispersion have changed.
3. Contextualize
Consider the timeframe, market regime, exchange, pair, liquidity, and broader market conditions. The same indicator reading may carry different meaning in a liquid market than in a thinly traded asset.
4. Calibrate
Examine whether current volatility conditions challenge the assumptions behind an existing research or risk framework. This step does not prescribe position size or stop-loss distance.
5. Review
Reassess the indicator readings as market conditions change. Historical relationships can strengthen, weaken, or normalize over time.
This framework treats volatility analysis as an ongoing research process rather than a fixed set of trading rules.
Common Interpretation Mistakes
Investors should avoid several common errors when using ATR and Bollinger Bands.
A high ATR is not automatically bullish or bearish. Narrow Bollinger Bands do not guarantee a breakout. A band touch does not require a reversal. Raw ATR values do not provide reliable comparisons across differently priced assets. Low volatility does not mean low investment risk.
Investors should also avoid applying one universal setting across every cryptocurrency and timeframe. A setting that provides useful context for Bitcoin on a daily chart may behave differently for a lower-liquidity altcoin on an hourly chart.
Final Thoughts
ATR and Bollinger Bands both analyze historical volatility, but they answer different questions.
ATR measures the magnitude of recent price ranges. Bollinger Bands visualize how prices disperse around a moving average. ATRP normalizes ATR relative to price, while BBW normalizes band width relative to the middle band.
These tools can help investors study volatility expansion, contraction, and changing market regimes. They cannot predict direction, determine asset quality, or measure total investment risk.
The most useful approach is not to choose a universal winner. It is to select the measurement that fits the analytical question, use consistent data and settings, and interpret the result alongside liquidity, market structure, fundamentals, and portfolio objectives.
Disclaimer
ATR, ATRP, Bollinger Bands, and BBW analyze historical market data. They do not predict future prices, guarantee trading outcomes, or remove cryptocurrency risk.
The examples and frameworks in this article are educational and do not constitute investment advice. Indicator readings may vary by exchange, trading pair, timeframe, calculation method, and market conditions. Investors should evaluate their objectives, liquidity needs, risk tolerance, and broader portfolio context before making financial decisions.