Best Crypto Technical Indicators: RSI, MACD, Moving Averages & More
A Professional Framework for Using RSI, MACD, Moving Averages, and Volatility Tools in Crypto Markets
- Why Technical Indicators Still Matter in Crypto (2025 Context)
- What Technical Indicators Are (and What They Are Not)
- Categories of Crypto Technical Indicators
- 1) Momentum Indicators
- 2) Trend Indicators
- 4) Volume and Market Strength Indicators
- Indicator Categories Overview (Reference Table)
- Why Category Awareness Matters More Than Indicator Choice
- Where This Guide Goes Next
- Core Crypto Indicators Explained
- How Professionals Actually Use Them in 2025
- Relative Strength Index (RSI): Measuring Momentum Regimes, Not Timing Entries
- What RSI Is Commonly Used For
- What RSI Is Not Designed to Do
- Moving Averages (SMA & EMA): Structural Trend Filters
- Professional Use Cases
- MACD: Interpreting Momentum Changes Within Trends
- Where Professionals Use MACD
- Bollinger Bands: Understanding Volatility Behavior, Not Direction
- Professional Applications
- Average True Range (ATR): Risk Calibration, Not Signal Generation
- Professional Uses of ATR
- Core Crypto Indicators — Functional Overview
- Why No Single Indicator Works Alone
- Common Misuse vs Professional Interpretation
- Connecting Indicators to Portfolio-Level Decisions
- How to Combine Indicators Safely
- Frameworks, Timeframes, and AI Context in 2025
- The Core Principle: Indicators Confirm — They Do Not Decide
- Indicator Confluence: Fewer Categories, Clearer Insight
- Ineffective Confluence (Redundant)
- Effective Confluence (Complementary)
- Timeframe Alignment: The Most Overlooked Skill
- Trending vs Ranging Markets: Indicator Behavior Changes
- In Trending Markets
- In Ranging Markets
- When Indicators Fail — And Why That’s Expected
- Portfolio-Level Indicator Use: The 2025 Shift
- The Role of AI in Indicator Interpretation
- Why Simplicity Outperforms Complexity
- Indicators and Behavioral Discipline
- How Forvest Uses Indicators: Risk First, Not Prediction
- When You Should Not Use Indicators
- Final Takeaway: Indicators Reduce Uncertainty — They Don’t Eliminate It
Why Technical Indicators Still Matter in Crypto (2025 Context)
Crypto markets in 2025 look very different from earlier cycles. Institutional participation is higher, liquidity is deeper across major assets, and regulatory frameworks are clearer in many regions. Yet crypto remains one of the most volatile and sentiment-driven financial markets.
That combination—structural maturity alongside persistent volatility—is exactly why technical indicators still matter.
Technical indicators are not prediction tools. They are decision-support frameworks that help investors interpret market behavior, identify trend conditions, and reduce emotional bias. In 2025, indicators are used less as “buy/sell signals” and more as context tools that support timing, exposure management, and portfolio discipline.
Professionals rarely rely on a single indicator. Instead, they use indicators to answer specific questions:
- Is the market trending or ranging?
- Is momentum strengthening or weakening?
- Is volatility expanding or compressing?
- Is price action aligned with broader market structure?
The skill is not memorizing indicator settings—it’s interpreting indicators in context, across timeframes, without forcing conclusions.
👉 How to Invest in Cryptocurrency: Step-by-Step Beginner’s Guide
What Technical Indicators Are (and What They Are Not)
Technical indicators are mathematical calculations derived from price, volume, and volatility data. Their purpose is to transform raw market movement into interpretable signals that describe behavior—rather than guess outcomes.
But it’s equally important to be explicit about what indicators do not do:
- They do not predict future prices
- They do not eliminate risk
- They do not work well in isolation
- They do not guarantee profitable outcomes
Indicators reflect historical behavior, not future certainty. Their value comes from interpretation and context—not mechanical execution.
In modern crypto analysis, indicators become far more useful when combined with:
- Market structure (trend/range regimes)
- Risk management rules (position sizing, invalidation levels)
- Asset context (liquidity, narrative cycle, major events)
- Portfolio constraints (allocation limits, rebalancing logic)
This is how indicators are used in professional markets: as filters and confirmations, not as standalone “signals.”
Categories of Crypto Technical Indicators
To use indicators effectively, you need to understand their function—not just their name. Each indicator category answers a different market question. Confusing these roles is one of the biggest reasons beginners misread signals.
Below are the four primary indicator categories most commonly used in crypto markets in 2025.
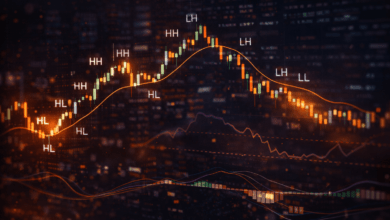
1) Momentum Indicators
Purpose: Measure the speed and strength of price movement.
Momentum indicators help identify whether buying or selling pressure is strengthening or fading. They can be useful in range-bound markets, and also near late-stage trends where momentum begins to weaken.
Common momentum indicators include:
- Relative Strength Index (RSI)
- Stochastic Oscillator
- Williams %R
A critical clarification: an “overbought” reading does not automatically mean price must fall, and an “oversold” reading does not guarantee a rebound. In strong trends, momentum can stay elevated (or suppressed) for extended periods.
Momentum indicators work best when used to:
- Spot momentum divergence
- Confirm trend exhaustion (carefully, with structure)
- Compare relative strength across assets
They should not be used as standalone timing tools.
2) Trend Indicators
Purpose: Identify the dominant market direction.
Trend indicators help determine whether price is moving upward, downward, or sideways over a chosen time horizon. In 2025, trend identification matters even more because institutional liquidity often reinforces trends rather than reversing them quickly.
Common trend indicators include:
- Simple Moving Averages (SMA)
- Exponential Moving Averages (EMA)
- Moving Average Convergence Divergence (MACD)
Trend indicators are naturally lagging—they confirm trends after they begin. This is not a flaw; it’s a feature. Their job is to reduce false signals, not catch exact tops or bottoms.
Professionals use trend indicators to:
- Align exposure with the dominant market direction
- Filter low-probability setups
- Manage risk during regime changes
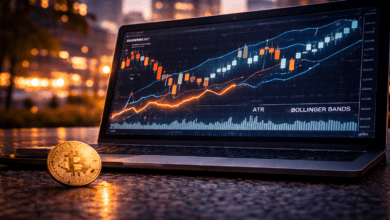
3) Volatility Indicators
Purpose: Measure how much price is fluctuating.
Volatility indicators do not predict direction. They describe the intensity of price movement—information that directly supports risk management, position sizing, and entry timing during calm vs unstable conditions.
Common volatility indicators include:
- Bollinger Bands
- Average True Range (ATR)
Volatility compression often precedes volatility expansion—but expansion does not indicate direction by itself. In crypto, volatility spikes frequently occur around macro events, major regulatory headlines, ETF flow shocks, or liquidation cascades.
Volatility indicators are most useful for:
- Identifying lower-risk environments (relative calm)
- Adjusting position size to match current conditions
- Avoiding overexposure during unstable regimes
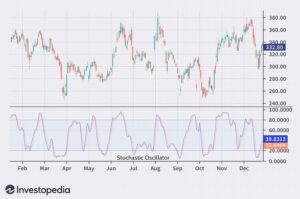
4) Volume and Market Strength Indicators
Purpose: Measure participation and conviction behind price moves.
Volume-based indicators help answer one of the most important questions in technical analysis:
Is this move supported by real participation?
Common volume indicators include:
- On-Balance Volume (OBV)
- Volume Profile
- Accumulation/Distribution indicators
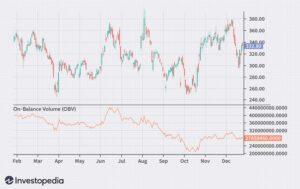
Source: Investopedia
In crypto, volume analysis is especially important because smaller assets can move sharply on thin liquidity. Strong price moves without volume confirmation often fail or reverse quickly.
Volume indicators help investors:
- Validate breakouts (or identify weak ones)
- Detect accumulation/distribution phases
- Spot divergence between price movement and participation
Indicator Categories Overview (Reference Table)
| Indicator Category | Examples | What They Measure | Best Used For |
| Momentum | RSI, Stochastic | Speed & strength of price moves | Detect exhaustion or divergence |
| Trend | SMA, EMA, MACD | Directional bias | Align with dominant market trend |
| Volatility | Bollinger Bands, ATR | Price fluctuation intensity | Risk management & position sizing |
| Volume | OBV, Volume Profile | Market participation | Confirm price validity |
Why Category Awareness Matters More Than Indicator Choice
One of the biggest beginner mistakes is asking “Which indicator is best?” instead of asking “What problem am I trying to solve?”
In reality:
- Momentum indicators don’t replace trend indicators
- Trend indicators don’t measure volatility
- Volatility indicators don’t confirm participation
- Volume indicators don’t indicate direction
Each category plays a distinct role inside a broader analytical framework.
Professionals start with market context, then choose indicators that fit that context—not the other way around.
Where This Guide Goes Next
This article is structured as a layered educational resource.
In the next section, we break down the most important individual crypto indicators for 2025, explain how professionals actually use them, and highlight the common misinterpretations that lead to avoidable mistakes.
This guide does not provide trading signals or “entry calls.” Instead, it focuses on building interpretation skills, reducing noise, and using indicators responsibly inside a risk-aware framework.
Core Crypto Indicators Explained
How Professionals Actually Use Them in 2025
In 2025, experienced crypto investors no longer use indicators as entry triggers. Instead, indicators are treated as contextual tools—designed to explain what kind of market environment exists and how risk should be managed within it.
This section does not teach trading setups or signal-based strategies.
Its purpose is to explain what each major indicator category measures, how professionals interpret it, and where misuse commonly leads to poor decisions.
Clarity—not complexity—is the goal.
Relative Strength Index (RSI): Measuring Momentum Regimes, Not Timing Entries
The Relative Strength Index (RSI) remains one of the most widely referenced indicators in crypto markets. Its simplicity makes it popular—but also frequently misunderstood.
RSI measures momentum behavior, not price value and not trend direction.
It evaluates the balance between recent gains and losses and expresses that relationship on a normalized scale from 0 to 100.
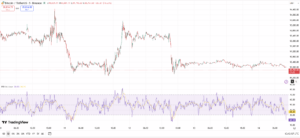
Chart source: TradingView.
This image is used for educational purposes to illustrate RSI behavior in real market conditions.
What RSI Is Commonly Used For
- Evaluating whether momentum is strengthening or weakening
- Identifying bullish or bearish divergence relative to price structure
- Distinguishing between momentum regimes (bullish vs bearish environments)
What RSI Is Not Designed to Do
- Predict precise reversals
- Signal exact market tops or bottoms
- Determine whether an asset is “cheap” or “expensive”
In strong crypto trends, RSI can remain elevated or suppressed for extended periods. Treating overbought or oversold levels as automatic reversal signals is one of the most persistent beginner mistakes.
Professional interpretation focuses on:
- Range behavior (how RSI behaves during bull vs bear regimes)
- Divergence aligned with structure, not isolated readings
- Multi-timeframe confirmation, rather than single-chart signals
For readers who want a focused breakdown of RSI behavior patterns and regime analysis, our dedicated internal guide explains this indicator in depth:
→ What Is RSI Indicator?
Moving Averages (SMA & EMA): Structural Trend Filters
Moving averages are foundational trend-following tools used across all major financial markets. Their role is not prediction—but trend confirmation and exposure filtering.
There are two primary forms:
- Simple Moving Average (SMA): Equal weighting across periods
- Exponential Moving Average (EMA): Greater emphasis on recent price data
Moving averages confirm trends after they form. This lag is intentional—it reduces noise and false signals.
Professional Use Cases
- Identifying dominant market direction
- Defining dynamic support and resistance zones
- Filtering exposure to align with trend bias
- Comparing trend strength across timeframes
In crypto, moving averages are particularly effective because liquidity cycles and narrative momentum often produce extended directional moves.
Professionals rarely rely on a single moving average. Instead, they observe:
- Short-term vs long-term relationships
- Slope and distance from price
- Interaction with broader market structure
A deeper explanation of trend interpretation using moving averages is covered in our internal resource:
→ Moving Averages in Crypto
MACD: Interpreting Momentum Changes Within Trends
The Moving Average Convergence Divergence (MACD) blends trend and momentum by measuring the relationship between two EMAs and a signal line.
MACD is most effective as a confirmation tool, not as a trigger.
Where Professionals Use MACD
- Identifying momentum shifts within existing trends
- Confirming continuation or weakening of directional moves
- Detecting divergence when aligned with price structure
Because MACD is derived from moving averages, it is inherently lagging—especially on higher timeframes. Its value lies in contextual confirmation, not early prediction.
Professional interpretation emphasizes:
- Histogram expansion or contraction
- Momentum behavior relative to structure
- Alignment with higher-timeframe trends
MACD is rarely used in isolation. It performs best when paired with trend filters such as moving averages.
Bollinger Bands: Understanding Volatility Behavior, Not Direction
Bollinger Bands measure volatility by plotting price relative to a moving average with statistically derived upper and lower bands.
They do not indicate direction.
The key question Bollinger Bands answer is:
Is volatility expanding or compressing?
Professional Applications
-
Identifying volatility contraction before expansion
-
Assessing whether price movement is statistically extreme
-
Adjusting position size based on volatility conditions
Price touching or exceeding a band does not imply reversal. In strong trends, price can remain near one band for prolonged periods—a phenomenon often misunderstood by beginners.
Average True Range (ATR): Risk Calibration, Not Signal Generation
Average True Range (ATR) measures average price movement over a given period.
It does not indicate trend, direction, or momentum.
ATR is a risk management instrument.
Professional Uses of ATR
- Adjusting position size relative to volatility
- Setting stop distances proportionate to market conditions
- Comparing volatility across assets
- Reducing exposure during unstable regimes
In crypto—where volatility regimes shift rapidly—ATR is essential for preventing unintentional overexposure.
Core Crypto Indicators — Functional Overview
| Indicator | Category | What It Measures | Primary Professional Use |
| RSI | Momentum | Strength & speed of price movement | Momentum regime & divergence |
| SMA / EMA | Trend | Directional bias | Trend confirmation & filtering |
| MACD | Trend + Momentum | Momentum within trend | Continuation confirmation |
| Bollinger Bands | Volatility | Price dispersion | Volatility expansion/compression |
| ATR | Volatility | Average movement | Risk & position sizing |
Why No Single Indicator Works Alone
Crypto markets are multi-dimensional systems.
Price, volume, volatility, liquidity, and sentiment interact simultaneously.
Expecting one indicator to capture all of this information leads to overconfidence and poor decisions.
Professionals build indicator confluence, not indicator stacks:
- Trend context → Moving averages
- Momentum behavior → RSI / MACD
- Volatility awareness → Bollinger Bands / ATR
- Participation confirmation → Volume tools
Confluence improves clarity. Excess indicators increase noise.
Common Misuse vs Professional Interpretation
| Indicator | Common Beginner Mistake | Professional Interpretation |
| RSI | Selling because RSI > 70 | Evaluate momentum regime |
| Moving Averages | Trading every crossover | Confirm broader trend |
| MACD | Acting on every signal cross | Use as confirmation |
| Bollinger Bands | Expecting reversal at bands | Assess volatility behavior |
| ATR | Ignoring it | Use for risk calibration |
Connecting Indicators to Portfolio-Level Decisions
In 2025, indicators are increasingly applied at the portfolio level, not only per asset.
Professional investors use indicators to:
- Reduce exposure during high-volatility regimes
- Maintain discipline during strong trends
- Compare relative strength across assets
- Avoid emotional reactions to short-term noise
This shifts indicators from speculative tools into risk-awareness frameworks.
For readers who want to apply indicator interpretation within a portfolio-level view, Forvest’s internal tools are built around this philosophy:
How to Combine Indicators Safely
Frameworks, Timeframes, and AI Context in 2025
By 2025, the most common and costly mistake crypto participants make with technical indicators is not choosing the wrong indicator, but using multiple indicators without a coherent framework.
Professional investors do not treat indicators as decision-makers.
They treat them as filters — tools that help reduce uncertainty, clarify market conditions, and control risk exposure.
This section explains:
-
how indicators are combined responsibly,
-
why timeframe alignment matters more than indicator choice,
-
when indicators fail by design,
-
and how AI-assisted analysis is reshaping indicator interpretation in modern crypto markets.
The Core Principle: Indicators Confirm — They Do Not Decide
No indicator, regardless of popularity or complexity, should ever be used in isolation.
Indicators exist to confirm an existing hypothesis, not to generate one.
Professional analysis almost always follows this order:
-
Market structure
(trend, range, regime) -
Liquidity and volatility context
(stable vs unstable participation) -
Timeframe alignment
(higher-timeframe bias first) -
Indicator confirmation
(momentum, volatility, participation)
Indicators come last, not first.
This hierarchy alone eliminates the majority of beginner errors and prevents over-reaction to short-term noise.
Indicator Confluence: Fewer Categories, Clearer Insight
Indicator confluence does not mean stacking multiple indicators of the same type.
It means combining different functional categories, each answering a distinct market question.
Ineffective Confluence (Redundant)
-
RSI
-
Stochastic RSI
-
CCI
(All momentum-based → overlapping information)
Effective Confluence (Complementary)
-
Moving Average (trend context)
-
RSI (momentum behavior)
-
ATR (volatility and risk)
Each indicator answers a different question:
-
Is there a dominant trend?
-
Is momentum supporting that trend?
-
How risky is participation right now?
When indicators disagree, professionals do not force a decision —
they reduce exposure, wait, or stay inactive.
Timeframe Alignment: The Most Overlooked Skill
One of the clearest differences between beginners and professionals is timeframe discipline.
Professionals never mix signals randomly across timeframes.
A common analytical structure:
-
Higher timeframe (weekly / daily)
Market regime and dominant trend -
Medium timeframe (daily / 4H)
Momentum behavior and structure -
Lower timeframe (1H / 15m)
Monitoring or execution context
If the higher timeframe is bearish, bullish signals on lower timeframes are treated as counter-trend noise, not opportunities.
Timeframe alignment filters out false signals more effectively than any indicator setting.
Trending vs Ranging Markets: Indicator Behavior Changes
Indicators do not behave consistently across all market conditions.
In Trending Markets
-
RSI remains elevated or suppressed
-
Moving averages act as dynamic support or resistance
-
Bollinger Bands expand
-
MACD confirms continuation more often than reversal
In Ranging Markets
-
RSI oscillates between neutral zones
-
Moving averages flatten
-
Bollinger Bands contract
-
False breakouts increase
Professionals identify the market regime first, then decide which indicators are even relevant.
Applying mean-reversion logic in trending markets — or trend tools in ranges — leads to systematic losses.
When Indicators Fail — And Why That’s Expected
Indicators fail most frequently during:
-
sudden liquidity shocks,
-
news-driven volatility,
-
macroeconomic announcements,
-
regulatory headlines,
-
forced liquidations or exchange disruptions.
In these conditions:
-
indicators lag,
-
signals conflict,
-
volatility overrides historical patterns.
Professionals respond by:
-
reducing position size,
-
widening risk limits,
-
or remaining inactive.
They do not “fix” indicators by adding more of them.
This is why risk management always matters more than signal accuracy.
Portfolio-Level Indicator Use: The 2025 Shift
In 2025, indicators are increasingly applied at the portfolio level, not only per asset.
Examples include:
-
using volatility indicators to scale overall exposure,
-
comparing RSI across assets for relative strength,
-
adjusting allocations based on trend regimes,
-
monitoring correlation risk during unstable periods.
This approach reframes indicators from trading tools into risk-awareness systems and aligns strongly with long-term capital preservation.
The Role of AI in Indicator Interpretation
AI does not replace indicators — it contextualizes them.
Modern AI systems assist with:
-
multi-timeframe pattern recognition,
-
reduction of cognitive bias,
-
detection of abnormal behavior,
-
aggregation of indicator signals into risk scores,
-
filtering noise during high-volatility phases.
Instead of asking:
“Is RSI oversold?”
AI-assisted analysis asks:
“Is current momentum behavior statistically abnormal relative to historical conditions and broader market context?”
This shift moves analysis away from signal-chasing toward probability and risk evaluation.
Why Simplicity Outperforms Complexity
Professional indicator frameworks are often surprisingly simple.
Not because professionals lack sophistication —
but because they understand that:
-
most indicator data overlaps,
-
more indicators increase noise,
-
clarity improves decision quality.
A simple framework applied consistently outperforms a complex system applied emotionally.
This principle underpins modern crypto risk management.
Indicators and Behavioral Discipline
Indicators are only as effective as the behavior of the person using them.
Common behavioral traps include:
-
forcing decisions because “an indicator said so,”
-
ignoring higher-timeframe context,
-
overreacting to short-term fluctuations,
-
adjusting indicators after losses,
-
seeking certainty in probabilistic systems.
Professionals treat indicators as decision aids, not authority figures.
How Forvest Uses Indicators: Risk First, Not Prediction
Forvest does not use indicators to predict price movements.
They are integrated to support:
-
Trust Score evaluation,
-
portfolio volatility assessment,
-
allocation balance,
-
long-term risk profiling.
This reflects institutional-grade analytical practice — not social-media trading culture.
When You Should Not Use Indicators
Sometimes the most professional decision is to ignore indicators entirely.
Examples include:
-
during major macro announcements,
-
when liquidity is extremely thin,
-
in highly manipulated low-cap assets,
-
when emotional bias is elevated,
-
when the market lacks clear structure.
Inaction is a valid position.
Final Takeaway: Indicators Reduce Uncertainty — They Don’t Eliminate It
Successful crypto investors in 2025 do not search for perfect indicators.
They build systems that combine:
-
market structure,
-
risk awareness,
-
timeframe alignment,
-
behavioral discipline,
-
a limited set of well-understood indicators.
Indicators do not provide answers.
They help manage uncertainty.
That distinction separates speculation from strategy.
FAQs for crypto technical indicators
Crypto technical indicators are mathematical tools used to analyze price, momentum, trend, volatility, and market participation in cryptocurrency markets.
Indicators are not predictive tools. In crypto, they are most reliable when used for context, trend confirmation, and risk management—not for signals.
In 2025, the most widely used crypto indicators include RSI, moving averages, MACD, Bollinger Bands, and ATR—each serving a different purpose.
Yes, beginners can use indicators safely by focusing on categories (trend, momentum, volatility) and avoiding signal-based or over-optimized setups.
Professionals combine indicators by category, align them across timeframes, and use them to confirm market structure rather than predict price moves.