Crypto Profit & Portfolio Calculation: Complete Guide + Tools (2025)
Calculate true profits after costs, backtest your strategy, and automate portfolio decisions with step-by-step workflows and free tools.

- Introduction
- Fundamentals
- Profit, Loss, and ROI (with a concrete example)
- Realized vs. Unrealized Gains (simple, numeric, tax-aware)
- Cost Components
- Portfolio Management (what it changes, numerically)
- Mark-to-Market, Base Currency, and Comparability
- Break-Even (make it explicit)
- The Behavioral Layer (discipline > precision)
- Investor Archetypes (use-case driven)
- Day Trader
- HODL Investor
- DCA Investor
- How to Calculate Real Crypto Profit (Simple 3-Step Workflow)
- Crypto Profit Example (One Bitcoin Trade)
- Common Calculation Mistakes (and the quick fix)
- Essential Performance Metrics for Crypto Portfolios (Investor-Friendly)
- ROI vs. Real Profit: When to use each
- CAGR (Annualized Return) for longer horizons
- Win Rate, Average Win/Loss, and Profit Factor for active strategies
- Break-Even Price (with costs)
- Volatility and Drawdown (your pain profile)
- Time Under Water (recovery time)
- Risk-Adjusted Return (Sharpe-style idea, no heavy math)
- Position Sizing and Rebalancing (the quiet compounding lever)
- Best Tools for Crypto Profit & Portfolio Calculation (2025 Comparison)
- What a good crypto profit calculator should include
- What a good crypto portfolio calculator should include
- When to use which (quick guide)
- Feature comparison
- How to pick (3 quick questions)
- Crypto Taxes 101: Realized vs. Unrealized, Cost Basis & Records
- Realized vs. Unrealized Gains
- Common Cost Basis Methods (be consistent)
- Wash-Sale / Superficial Loss Notes (high level)
- What Counts Toward Proceeds and Costs
- Record-Keeping Checklist (audit-friendly)
- Helpful Workflow
- Portfolio Management That Survives Volatility (Sizing, Rebalancing, Discipline)
- Pre-Trade & Quarter-End Checklist (copy-ready)
- 📥 Download Trading Checklist (JPEG)
Crypto profit isn’t just “sell minus buy.” True results depend on fees, spreads, slippage, and exit costs—plus portfolio factors like position sizing, drawdown, and rebalancing. This guide gives the math, a step-by-step workflow, numeric examples, and investor-ready tools to calculate real P/L and manage a crypto portfolio more reliably.
Introduction
If you’ve ever celebrated a green screenshot only to realize later that fees and slippage quietly ate your gains, you’re not alone. In crypto, what you keep matters more than what the chart suggests. Prices move fast; costs hide in small places; and a few undisciplined decisions can turn a “good idea” into a mediocre outcome.
This guide is a complete, investor-focused playbook for calculating profit at the trade and portfolio level—so you can replace guesswork with a repeatable process. We’ll start with foundations (profit vs. ROI, realized vs. unrealized), then move to the exact formulas and a six-step calculation workflow. You’ll see worked examples (including BTC/ETH scenarios), learn advanced metrics (break-even, win rate, drawdown, Sharpe-style thinking), and get a comparison framework for choosing (and using) calculators. We’ll also cover tax considerations, common mistakes, and give you a clean checklist you can run before and after every trade.
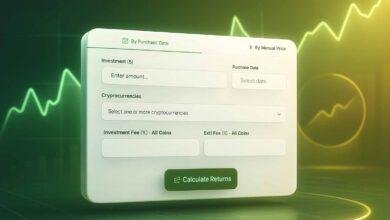
Where the rubber meets the road, you’ll find two practical tool paths:
-
Crypto Profit Calculator — to compute true P/L with costs and slippage, fast.
-
Crypto Portfolio Calculator — to track aggregate P/L, surface risk (e.g., max drawdown and time under water), and add rebalancing discipline.
The goal isn’t perfection; it’s consistency. A clear formula, a short checklist, and a habit of logging outcomes will do more for your results than hunting the perfect entry. By the end, you’ll know how to calculate properly, evaluate honestly, and manage position sizes so your strategy survives the volatility that makes crypto exciting—yet unforgiving.
Fundamentals
Profit, Loss, and ROI (with a concrete example)
-
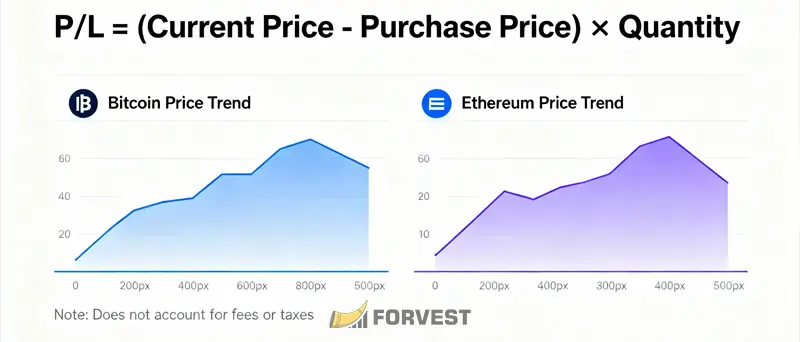
Profit (P/L) at the single-trade level (paper version):
P/L = (Sell − Buy) × Quantity
Real P/L deducts fees, spreads, slippage, and exit costs (see §2.3). -
Loss is negative P/L. Treat losses as paid feedback about frictions (costs, timing, sizing) you missed.
-
ROI (Return on Investment) measures efficiency:
ROI = P/L ÷ Cost Basis × 100%
Numeric example (with costs):
-
Invest $10,000 in BTC
-
Buy 0.25 BTC @ $40,000 → cost basis = $10,000
-
Sell 0.25 BTC @ $50,000 → gross proceeds = $12,500
-
Total fees (entry + exit) = $50
Real P/L = $12,500 − $10,000 − $50 = $2,450
ROI = $2,450 ÷ $10,000 × 100% = 24.5%
Ready to calculate your ROI with fees included? Use the Crypto Profit Calculator to compute real P/L in seconds.
Realized vs. Unrealized Gains (simple, numeric, tax-aware)
-
Realized: position closed → outcome locked (often tax-relevant).
-
Unrealized: position open → outcome floating (can change anytime).
Numeric example:
-
You bought 1 ETH @ $1,500.
-
Today’s price $2,000.
-
If still holding: $500 unrealized gain.
-
If you sell now (and pay, say, $5 fee): $495 realized gain.
Same price move—very different implications for taxes and portfolio decisions.
Cost Components
What to include:
-
Trading fees (both sides), spread (bid/ask gap), slippage, network/withdrawal fees, and for derivatives funding/borrow costs. Taxes are handled separately but affect net results.
Impact demo:
Suppose your strategy averages 0.30% total friction per round trip (fees + spread + slippage). On a $10,000 rotation, that’s $30. Over 100 trades, you’ve given up $3,000—often the difference between a decent and a disappointing year.
Avoid “phantom profits.” The Crypto Profit Calculator lets you enter fees and slippage so your output reflects what you actually keep.
Portfolio Management (what it changes, numerically)
A portfolio isn’t a coin list—it’s a risk-budget with rules. Your calculator should expose aggregate P/L, pain profile (max drawdown; time under water), and weight drift.
Over-concentration example:
-
$20,000 portfolio
-
60% in one alt = $12,000
-
Coin drops −40% → portfolio hit = −24% × 0.60 = −14.4% from that coin alone.
A simple position cap (e.g., ≤30% per asset) halves that single-asset damage.
See the pain path, not just the balance. The Crypto Portfolio Calculator highlights max drawdown and time under water so you can size positions you’ll actually hold.
Mark-to-Market, Base Currency, and Comparability
-
Mark-to-market (MTM): value positions at current prices to assess today’s risk.
-
Base currency: pick one (e.g., USD) and stay consistent; consider a secondary local-currency view for real-life context.
-
Comparability: When comparing ROI across assets, keep timeframe, cost model, and sizing logic consistent—or the comparison misleads.
Break-Even (make it explicit)
Break-even is where P/L = 0 after costs.
If your round-trip friction ~0.30%, your break-even on a long is Buy × (1 + 0.003).
Example: buy at $1,500 → break-even ≈ $1,504.50.
The Behavioral Layer (discipline > precision)
Same system, different outcomes—because behavior differs.
-
Oversizing → panic exits
-
Tinkering → fee drag
-
Ignoring risk → small losses snowball
A calculator can’t remove emotions, but it constrains them. When you see drawdown and time under water, you naturally pick sizes and rules you can live with.
Investor Archetypes (use-case driven)
Different investors need different metrics. Here’s how to focus your calculations.
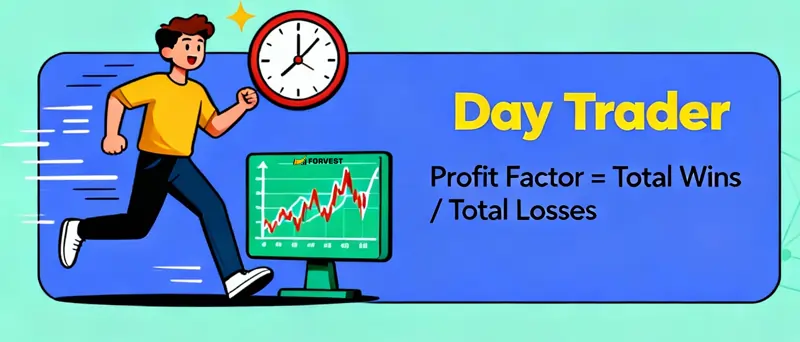
Day Trader
-
Focus: Win rate, average win/loss, profit factor, Sharpe-style stability.
-
Key formula:
Profit Factor = (Wins × Avg Win) ÷ (Losses × Avg Loss) -
Example: 50 trades → 30 wins @ $150 avg; 20 losses @ $100 avg
Profit Factor = (30 × 150) ÷ (20 × 100) = 2.25 (healthy) -
Tip: Track effective costs per trade; small frictions compound fast.

The HODL archetype seeks long-term gains by holding through volatility and tracking annualized ROI.
HODL Investor
-
Focus: Long-horizon annualized ROI, drawdown depth/length (can you hold through it?).
-
Key formula:
Annualized ROI = (Ending ÷ Beginning)^(1/Years) − 1 -
Example: Buy 1 BTC @ $25K (2020) → $70K (2025)
Annualized ROI ≈ (70/25)^(1/5) − 1 ≈ 23.2% -
Tip: Use position caps and a rebalance cadence; smaller and shorter drawdowns are easier to live with.

The DCA investor builds crypto positions steadily by recurring buys, focusing on average entry price and disciplined contributions.
DCA Investor
-
Focus: Average entry price vs. current price; steady contribution discipline.
-
Key formula:
Avg Entry = Total Invested ÷ Total Coins -
Example: $100/month for 12 months at varying prices → Avg Entry ≈ blended cost; if current price is 28% higher, you’ve got a 28% gain (before costs).
-
Tip: In calculators, log each contribution with fees; compare real P/L to a no-cost baseline quarterly.
Where to start now?
For single-trade clarity, run your last two entries through the Crypto Profit Calculator (include fees/slippage). For portfolio reality, import transactions into the Crypto Portfolio Calculator and review max drawdown and time under water before setting position caps and a rebalance rule.
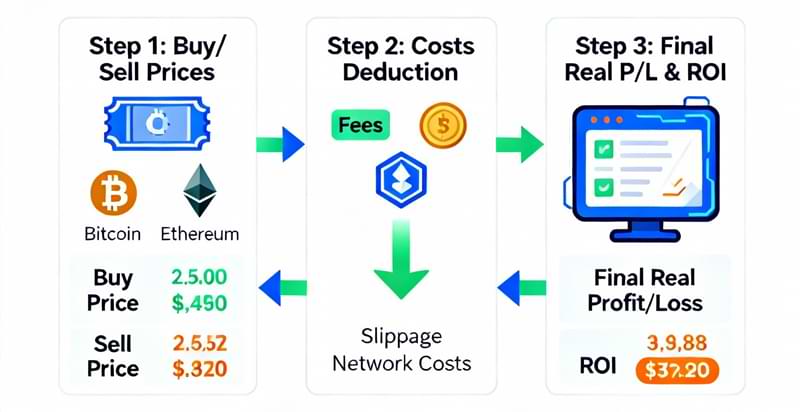
How to Calculate Real Crypto Profit (Simple 3-Step Workflow)
Step 1 — Use actual fills (not chart prices).
Grab the real buy/sell price, executed quantity, and fees from your exchange history.
Step 2 — Add all frictions.
Include both-side fees, a small slippage assumption (e.g., 0.10–0.20% per round trip), plus any withdrawal/network or funding costs.
Step 3 — Compute real P/L and ROI.
Real Profit = (Sell − Buy) × Quantity − All Costs
ROI (%) = Real Profit ÷ Initial Cost × 100
Tip: If total round-trip friction is ~0.30%, your break-even sell price is roughly Buy × 1.003.
Crypto Profit Example (One Bitcoin Trade)
-
Buy 0.20 BTC @ $40,000 → notional $8,000
-
Sell 0.20 BTC @ $45,000 → notional $9,000
-
Costs: $34 total (e.g., $17 fees + $17 slippage/other)
Paper profit: $1,000
Real profit: $1,000 − $34 = $966
ROI: $966 ÷ $8,000 × 100 = 12.1%
Key takeaway: Without tracking costs, you’d report $1,000 (12.5%) and miss $34 of real drag. Over many trades, ignoring small frictions can erase a big chunk of returns.
Ready to see your true numbers? Use the Crypto Profit Calculator to enter buy/sell, quantity, and costs—then get real P/L in seconds.
Common Calculation Mistakes (and the quick fix)
-
Using last price instead of fills: always use executed prices.
-
Counting one-side fees only: include entry + exit.
-
Ignoring slippage/spread: add a modest baseline and refine monthly.
-
Mixing currencies: convert all legs to one base (e.g., USD) before computing.
-
Forgetting exit costs: include withdrawal/network and (if applicable) funding.
 Learn more: A Complete Beginner’s Roadmap to Crypto Investing
Essential Performance Metrics for Crypto Portfolios (Investor-Friendly)
ROI vs. Real Profit: When to use each
-
Real Profit ($): shows actual dollars gained or lost after costs.
-
ROI (%): compares efficiency across different positions or sizes.
Use both: dollars tell impact; percent tells efficiency.
CAGR (Annualized Return) for longer horizons
CAGR summarizes multi-year performance into a single annual growth rate. Use it to compare long-term strategies or “buy-and-hold” results on BTC/ETH versus your diversified portfolio.
Example: $10K invested in BTC (2020 @ $25K) → now $70K (2025) CAGR ≈ 23.2% annually. This lets you compare to S&P 500’s 10% fairly.
Win Rate, Average Win/Loss, and Profit Factor for active strategies
-
Win Rate: % of profitable trades.
-
Average Win/Loss: typical gain vs. typical loss.
-
Profit Factor: total gains ÷ total losses (above 1.5–2.0 is generally healthy).
Great for frequent traders; less useful for low-turnover investing.
Break-Even Price (with costs)
Your sell price where P/L turns positive after fees/slippage. As a rule of thumb, if round-trip friction ≈ 0.30%, break-even ≈ Buy × 1.003. This stops you from “celebrating” tiny moves that are still net negative.
Volatility and Drawdown (your pain profile)
-
Volatility: how much returns bounce around. Higher volatility demands smaller position sizing.
-
Max Drawdown: worst peak-to-trough loss over a period. Pairs perfectly with ROI/CAGR to judge return per unit of pain.
Time Under Water (recovery time)
How long it takes to get back to a previous equity peak after a decline. Shorter is better—long recoveries are emotionally draining and raise the chance of abandoning your plan.
Risk-Adjusted Return (Sharpe-style idea, no heavy math)
You want more return per unit of volatility. Even without formulas, compare strategies by asking: ”For similar pain, which won?”
Example: Buy-and-hold BTC = 25% return, 50% drawdown. DCA = 18% return, 25% drawdown. Winner? DCA (better returns per unit of pain).
Position Sizing and Rebalancing (the quiet compounding lever)
-
Sizing: cap each asset (e.g., ≤20–30%) so one coin can’t sink the ship.
-
Rebalancing: periodically trim winners and add to laggards to control risk drift and lock in some gains.
Want to review max drawdown and rebalancing needs for your portfolio? Use the Crypto Portfolio Calculator to import transactions and get these metrics instantly
Best Tools for Crypto Profit & Portfolio Calculation (2025 Comparison)
What a good crypto profit calculator should include
-
Real P/L, not paper P/L: both-side fees, spreads, slippage, network/withdrawal costs.
-
Multiple legs support: laddered buys/sells roll up to one result.
-
Break-even & ROI: auto-calc your break-even price and % return.
-
Consistent base currency: clean USD (or chosen base) outputs.
-
Exportable logs: CSV/Excel for audit and taxes.
What a good crypto portfolio calculator should include
-
Aggregated metrics: ROI/CAGR, volatility, max drawdown, time under water.
-
Position sizing caps & rebalancing: simulate caps (e.g., ≤30%/asset) and calendar/threshold rebalances.
-
Scenario testing: compare “current vs. proposed” allocations side by side.
-
Holdings hygiene: detect missing fees, duplicates, or currency mix-ups.
-
Simple import: past trades in, clean portfolio analytics out.
When to use which (quick guide)
-
Single trade clarity → Profit Calculator (what did I really make after costs?)
-
Whole portfolio reality → Portfolio Calculator (is my plan holdable under drawdowns?)
-
Before changing venues/order style → Profit Calculator (A/B test slippage/fees assumptions)
-
Before trimming or rebalancing → Portfolio Calculator (see impact on DD and recovery time)
Feature comparison
| Feature | Forvest Profit | Forvest Portfolio | Koinly | CoinStats |
|---|---|---|---|---|
| Real P/L (fees + slippage) | ✅ YES | ✅ YES | ⚠️ Basic | ⚠️ Basic |
| Break-even Price | ✅ YES | ✅ (aggregated) | ❌ | ❌ |
| Multi-leg Trades (DCA) | ✅ YES | ✅ YES | ✅ YES | ✅ YES |
| Max Drawdown / Time Under Water | ❌ | ✅ YES | ⚠️ Limited | ✅ YES |
| Rebalance Simulation | ❌ | ✅ YES | ⚠️ Limited | ⚠️ Limited |
| Scenario Testing (what-if) | ✅ YES | ✅ YES | ❌ | ❌ |
| Export Results (CSV) | ✅ YES | ✅ YES | ✅ YES | ✅ YES |
| Sign-up Required | ❌ NO | ❌ NO | ✅ YES | ✅ YES |
| Price | 🟢 FREE | 🟢 FREE | 🔴 $199+/year | 🔴 $10+/month |
| Best For | Quick scenarios | Portfolio planning | Full automation + tax | Real-time tracking |
Legend: ✅ best-in-class | ⚠️ partial/depends | ❌ missing / not typical
How to pick (3 quick questions)
-
Am I checking one trade or my whole plan?
One trade → Profit Calculator. Whole plan → Portfolio Calculator. -
Do costs/liquidity matter a lot here?
Thin books/market orders → test slippage assumptions explicitly.
Will I act on the result today?
If yes, use the tool that shows break-even, DD, and recovery—not just a pretty number.
Crypto Taxes 101: Realized vs. Unrealized, Cost Basis & Records
Disclaimer: Tax treatment varies by country and can change. This section is informational only—confirm rules with a qualified advisor in your jurisdiction.
Realized vs. Unrealized Gains
-
Realized: You sell, swap, or spend a coin (or receive income like staking/airdrops). These events typically trigger capital gains/losses or ordinary income.
-
Unrealized: You still hold the asset. Paper gains/losses normally aren’t taxed until disposal.
Holding Periods
Many systems distinguish short-term (≤ 12 months) and long-term (> 12 months) gains, with long-term often taxed at a lower rate. Same exit price, different net result—because the clock matters.
Common Cost Basis Methods (be consistent)
-
FIFO (First In, First Out): Sells oldest lots first—simple, widely allowed.
-
LIFO (Last In, First Out): Sells newest lots first—can shift gains between years.
-
Specific Identification: You pick lots to sell if you have proper records—flexible but requires meticulous documentation.
FIFO vs. LIFO—Why it Changes the Bill (Simple Example)
You bought 1.0 BTC in two lots:
-
Lot A: 0.5 BTC @ $20,000 (cost $10,000)
-
Lot B: 0.5 BTC @ $60,000 (cost $30,000)
You sell 0.5 BTC @ $70,000 (proceeds $35,000 after fees).
-
FIFO (sell Lot A): gain = $35,000 − $10,000 = $25,000
-
LIFO (sell Lot B): gain = $35,000 − $30,000 = $5,000
Same sale, very different reported gain because of basis method. If your rules permit, Specific ID can let you choose lots strategically—but only with clean, time-stamped evidence.
Wash-Sale / Superficial Loss Notes (high level)
-
United States (2025): Traditional wash-sale rules apply to securities; crypto has not been explicitly included at the federal level. Policy could change—verify current guidance.
-
Canada/UK and some others: “Superficial loss” or similar concepts may apply to crypto if you repurchase the same (or identical) property within a defined window. Check local definitions and timeframes.
What Counts Toward Proceeds and Costs
-
Proceeds: Value received at disposal (minus platform exit fees).
-
Costs: Trading fees (both sides), maker/taker fees, and network/withdrawal fees tied to disposal. Slippage/spread is typically not a separate tax line, but your real P/L should reflect it operationally.
-
Income Events: Staking/yield/airdrops may be income when received, then later a capital gain/loss on disposal.
Quick Numeric Illustration (capital gain)
Buy 0.5 ETH for $1,500 (fees included). Sell later for $2,100, exit fee $15.
-
Gross gain: $2,100 − $1,500 = $600
-
Net gain after exit fee: $585 (amount potentially subject to capital-gains rules)
Record-Keeping Checklist (audit-friendly)
-
Executed prices/quantities, fees (entry/exit), TX hashes/IDs, timestamps, and wallet/exchange sources.
-
A single base currency (e.g., USD) for all conversions.
-
Clear note of basis method (FIFO/LIFO/Specific ID) and supporting lot-selection evidence.
-
Monthly YTD gain/loss export—avoid last-minute chaos.
Helpful Workflow
-
Export exchange/wallet data regularly (CSV).
-
Normalize to one base currency.
-
Classify disposals vs. transfers (transfers aren’t taxable disposals).
-
Reconcile staking/yield entries as income where applicable.
-
Run YTD reports monthly; adjust before year-end.
Transition → Portfolio Management
With taxes clarified—especially cost basis and holding periods—you’re ready to structure a portfolio you can actually hold through volatility. Next up: position sizing, rebalancing, and alerts that keep risk in line with your plan.

Portfolio Management That Survives Volatility (Sizing, Rebalancing, Discipline)
Build a one-page policy. Define target weights (e.g., BTC 40% / ETH 30% / Cash/Others 30%), a max position cap (e.g., ≤ 30% per asset), a rebalance rule (calendar or threshold), and a contribution cadence (e.g., monthly DCA).
Learn more: Crypto Portfolio Management Explained
Position Sizing that Fits Your Pain Tolerance
-
Max cap per asset: Prevents one coin from dominating outcomes (and emotions).
-
Vol-aware sizing: If Asset X is twice as volatile as Asset Y, consider half the weight to keep portfolio swings comparable.
-
Risk budget per idea: Higher-risk coins get smaller slots by design.
Rebalancing: Three Practical Modes
-
Calendar (monthly/quarterly): Simple, predictable, suitable for busy investors.
-
Threshold (±5–7 pp drift): Trades only when weights move outside a band—less churn, responsive to big moves.
-
Hybrid: Calendar check with threshold triggers—common “best of both.”
Why Rebalance Matters
It reins in risk drift, harvests gains from over-weights, and funds under-weights methodically. No predictions required—just rules.
DCA, But With Guardrails
-
Commit fixed contributions on a schedule.
-
Add a guardrail: if price is X% above the 30-day average, split the buy into 2–3 tranches.
-
Review quarterly; DCA is about discipline, not perfect timing.
Keep a Cash Sleeve on Purpose
-
10–20% cash reduces forced selling in panics and provides dry powder for opportunities.
-
If you park it for yield, ensure liquidity terms match your needs.
Set Smart Alerts (Don’t Let Alerts Run You)
-
Price alerts only at levels that correspond to your plan (supports decisions you already defined).
-
Portfolio alerts: max drawdown threshold, single-asset cap breach, or rebalance triggers.
Measure What You Can Actually Hold
Track ROI/CAGR alongside max drawdown and time under water. If the pain profile exceeds your tolerance, reduce sizes or increase cash—don’t abandon the plan mid-drawdown.
Quality First: Selection Filters
Favor assets with liquidity, survivability, and credible fundamentals. Complement headlines with a structured reliability screen (e.g., trust scoring) to avoid low-quality bets. Revisit assumptions after regime shifts (policy/liquidity changes).
Quarterly Checklist (fast, actionable)
-
✅ Recalculate weights vs. targets; rebalance if drift > band.
-
✅ Review drawdown and time under water; adjust sizing or cash.
-
✅ Reduce friction (fees/venues/order types) where possible.
-
✅ Update tax lots and note lots approaching long-term status.
-
✅ Pick one improvement to test next quarter (not five).
Mini Examples You Can Replicate
-
ETH drifted from 30% → 36%: trim 1–2 pp and log realized P/L; check if max drawdown improves.
-
Thin alt fills badly: switch venue or use limits; measure slippage reduction next month.
-
Cash sleeve at 5% feels too tight: increase to 12–15% and observe stress reduction (and holdability).
Pre-Trade & Quarter-End Checklist (copy-ready)
Pre-Trade (single position)
-
☐ Confirm thesis & timeframe (swing / long-term).
-
☐ Set position size (≤ max cap per asset).
-
☐ Note entry, invalidations/stop, profit targets.
-
☐ Estimate fees + slippage (venue, order type).
-
☐ Calculate break-even price.
-
☐ Create price/portfolio alerts (breach, rebalance, DD).
-
☐ Log decision in journal (why now? what would change your mind?).
-
☐ Run the Crypto Profit Calculator to preview real P/L at targets.
Pre-Change (portfolio action)
-
☐ Current weights vs. target weights.
-
☐ Any holding > cap? Plan trims.
-
☐ Rebalance rule: calendar or threshold met?
-
☐ Projected max drawdown / time under water if you rebalance.
-
☐ Tax lots: short- vs long-term; consider Specific ID if allowed.
-
☐ Use the Portfolio Calculator to compare before/after scenarios.
Quarter-End (maintenance)
-
☐ Export all trades (CSV), reconcile fees & transfers.
-
☐ Update YTD gains/losses, cost basis (FIFO/LIFO/Spec ID).
-
☐ Review DD, ToW, volatility; adjust sizing/cash sleeve.
-
☐ Reduce friction (better venue tiers, more limits, fewer micro-trades).
-
☐ Refresh watchlist using a reliability/trust screen.
-
☐ Decide one improvement to test next quarter (not five).
📥 Download Trading Checklist (JPEG)
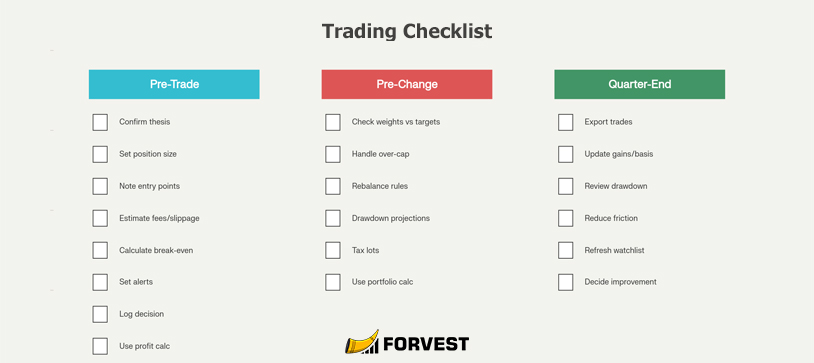
systematic decision-making. Download, print, and use before every trade.
Related:
FAQ
Calculate crypto profit in 3 steps: (1) Use actual fill prices and quantities from your exchange, (2) Subtract all costs including fees, slippage, and withdrawal fees, (3) Compute Real P/L = (Sell Price - Buy Price) × Quantity - All Costs. Always track your cost basis and holding period for accurate results.
Paper profit shows the theoretical gain based on chart prices without considering trading costs. Real profit deducts all fees (entry + exit), slippage, spread impact, and network costs from your gains. Real profit is always lower than paper profit and represents what you actually keep.
Trading fees, maker/taker fees, and withdrawal costs typically reduce profits by 0.3-1% per round trip. Over 100 trades, these "small" fees can cost $3,000+ on a $10,000 rotation. Always include both-side fees when calculating ROI to avoid overestimating returns.
Slippage is the difference between expected price and actual execution price, especially in market orders or thin liquidity. A typical slippage assumption is 0.05-0.20% per trade. On large orders or volatile markets, slippage can be higher and materially impact your realized profit.
ROI (Return on Investment) = (Real P/L ÷ Cost Basis) × 100%. For example: you invest $10,000 in BTC, sell for $12,500, and pay $50 in fees. Real P/L = $2,450. ROI = ($2,450 ÷ $10,000) × 100 = 24.5%.
Break-even price is where P/L = 0 after all costs. Formula: Break-even ≈ Buy Price × (1 + Round-Trip Friction %). If total fees and slippage = 0.30%, your break-even on a $40,000 BTC buy is approximately $40,120. This helps you avoid celebrating moves that are still net negative.
DCA (Dollar-Cost Averaging) is investing a fixed amount on a regular schedule regardless of price. To calculate: sum all your purchases, divide total invested by total coins acquired to get average entry price. Compare that average to current price to see your unrealized gain or loss.
Portfolio ROI = (Current Total Value - Total Invested - All Fees) ÷ Total Invested × 100%. Track each coin's contribution separately, then aggregate. For multi-year portfolios, also calculate annualized ROI (CAGR) to compare performance across different time periods.
Realized gains occur when you sell, swap, or spend a coin—the outcome is locked and often taxable. Unrealized gains are paper gains while you still hold the asset; the value can change at any time and typically isn't taxed until disposal. Always track both separately for tax and portfolio decisions.
Crypto profits are taxable when you realize a gain through selling, swapping, spending, or receiving income (staking/airdrops). Simply holding a coin with floating market value produces unrealized gains that are not taxed in most jurisdictions. Tax treatment varies by country—verify local rules.
Many jurisdictions distinguish short-term (≤12 months) and long-term (>12 months) gains, with long-term often taxed at a lower rate. Same exit price can result in different after-tax outcomes depending on how long you held the asset. Track acquisition dates carefully.
Cost basis methods determine which lots you sell first: FIFO (First In, First Out) sells oldest lots, LIFO (Last In, First Out) sells newest, and Specific Identification lets you choose if you have proper records. FIFO vs LIFO can create vastly different tax bills on the same trade.
Keep executed prices, quantities, fees (entry and exit), transaction IDs, timestamps, wallet addresses, and TX hashes. Document your basis method (FIFO/LIFO/Specific ID), track fair-market value at acquisition and disposal, and export all trades monthly. Audit-ready records prevent last-minute chaos.
Max drawdown = worst peak-to-trough loss over a period. Example: portfolio peaks at $50,000, drops to $35,000 = -30% drawdown. Time under water = how long it takes to recover to the previous peak. Both metrics help you size positions you can actually hold through volatility.
Yes, rebalancing controls risk drift and harvests gains systematically. Choose calendar (monthly/quarterly), threshold (only when weights drift ±5-7pp), or hybrid mode. Rebalancing trims over-performing assets back to plan and funds under-weights without emotion-driven decisions.
DCA means investing a fixed dollar amount on a regular schedule (e.g., $100 weekly into BTC) regardless of price. This averages your entry cost over time and removes timing pressure. Add guardrails: if price spikes >X% above 30-day average, split the buy across 2-3 tranches.
A 10-20% cash sleeve reduces forced selling during panics and provides dry powder for opportunities. Park it in low-risk yield only if liquidity terms match your needs. Cash acts as a shock absorber that makes your strategy easier to hold through downturns.
The best crypto profit calculator includes real P/L (fees + slippage), break-even price, multi-leg trade support, date-based calculations, and scenario testing ("what if I bought X instead?"). Forvest Profit Calculator offers these features free with no sign-up required.
A good calculator must account for both-side fees, spreads, slippage, network/withdrawal costs, and support multiple entries (DCA). It should display break-even price, ROI, and allow what-if comparisons. Exportable results and consistent base currency (USD) are essential for clean record-keeping.
If you make more than 5 trades per month or hold multiple coins, a portfolio tracker helps. It aggregates P/L across assets, surfaces risk metrics (max drawdown, time under water), and supports rebalancing decisions. For manual control and backtesting, consider Forvest Portfolio Calculator.
Ignoring fees and slippage. Many investors calculate paper profit (sell minus buy) without deducting trading fees, spreads, slippage, and network costs. This "phantom profit" can overstate returns by 5-20%. Always use actual fill prices and include all frictions for real P/L.
Wash-sale rules disallow loss deductions if you rebuy the same asset within a defined window. In the US (2025), crypto is not explicitly covered at the federal level, but rules may change. In Canada/UK, superficial loss rules may apply. Check local regulations before tax-loss harvesting and rebuying.
FIFO vs LIFO can create dramatically different tax outcomes. Example: sell 0.5 BTC at $70K. If FIFO uses your $20K lot, gain = $25K. If LIFO uses your $60K lot, gain = $5K. Same sale, different reported gain. Choose your method early and apply consistently all year.
Start with a pre-trade checklist: confirm your thesis, set position size (≤ max cap), note entry/exit levels, estimate fees and slippage, calculate break-even, and log your decision. Use the Crypto Profit Calculator to preview real P/L before entering the trade.
Quarterly reviews are standard for rebalancing, cost basis updates, and risk metric checks (drawdown, time under water). Set weekly alerts for major price moves or position cap breaches, but avoid daily tinkering. Discipline beats frequency—stick to your calendar rebalance rule.
Use profit calculators for scenario planning: test different coins, entry prices, and fee assumptions. Include both-side fees and realistic slippage (0.10-0.20%). Compare paper vs real P/L to understand friction impact. Export results for tax records and log each trade with your decision rationale.