
- Part 1 — Predicting Crypto Prices with AI (What It Can and Can’t Do)
- Why crypto prediction is hard (and why most content fails)
- What “AI crypto prediction” should mean in a serious analysis
- Common model families used in predicting crypto prices with AI
- AI model types for crypto price prediction (practical view)
- Signals that actually matter (and how AI uses them)
- Signal categories for AI crypto analysis (what they add and what they can’t)
- A professional, investor-safe workflow (no hype)
- What makes an AI crypto prediction claim trustworthy
- Quick note on ethics and expectations
- Part 2 — How to Evaluate AI Crypto Predictions (So You Don’t Get Tricked by “Accuracy”)
- 1) Start by defining what “good prediction” means
- 2) The #1 mistake: validation that leaks the future
- 3) Walk-forward backtesting (the only sane default)
- 4) Metrics that matter (and metrics that mislead)
- Evaluation metrics by prediction type (what to use, what to avoid)
- 5) Baselines: your model must beat something simple
- 6) Regime robustness: the hidden test that separates pros from amateurs
- 7) Probability calibration (the most ignored “AI” topic)
- 8) Don’t ignore costs: friction kills fragile models
- 9) A clean, practical evaluation checklist
- “Green flags vs Red flags” when evaluating AI crypto prediction pages
- What this means for your pillar (and internal linking)
- Part 3 — Building an AI Crypto Price Prediction Pipeline (Data → Model → Monitoring)
- 1) Define the product output (what you will publish)
- 2) Data layer: the three pillars of crypto prediction
- 3) Feature engineering: what usually works (and what often fails)
- 4) Model selection: choose boring, win long-term
- 5) Training and validation: walk-forward by default
- 6) Post-processing: make predictions usable (and honest)
- 7) Monitoring in production: the part most blogs ignore
- 8) Practical blueprint: what to build first (minimal → robust)
- End-to-end pipeline checklist (what “good” looks like)
- Bullet list — Common failure points (avoid these)
- Conclusion: what “Analyze Cryptocurrencies with AI” should actually promise
Part 1 — Predicting Crypto Prices with AI (What It Can and Can’t Do)
Crypto price prediction is one of the most searched topics in this space, and for a reason: investors want a repeatable way to turn noisy markets into a structured decision. But in practice, AI crypto prediction is not a magic “future-price generator.” It’s a way to estimate probabilities under specific assumptions—using historical patterns, cross-asset context, and real-time signals.
If your goal is crypto analysis with AI (not hype), you need two things:
-
A clear definition of what you’re predicting (direction, range, volatility, regime).
-
A disciplined evaluation method that survives changing market conditions.
Why crypto prediction is hard (and why most content fails)
Crypto is uniquely difficult for forecasting because it combines:
-
Regime shifts (bull/bear transitions, liquidity cycles)
-
Reflexivity (crowd behavior changes the outcome)
-
Non-stationary data (yesterday’s relationships can break tomorrow)
-
Event risk (exchange incidents, regulatory headlines, macro surprises)
So when someone says “AI predicts Bitcoin will hit X,” treat it as marketing unless you can see:
-
the target definition,
-
the data used,
-
the validation method,
-
and the limitations.
A professional approach starts with this mindset:
AI helps you measure and compare scenarios. It does not remove uncertainty.
In practice, AI forecasting is only one layer; the full decision workflow is outlined in our market analysis framework.
What “AI crypto prediction” should mean in a serious analysis
In a strong cryptocurrency price analysis with artificial intelligence workflow, prediction is usually one of these four targets:
-
Direction: Up/Down over a defined horizon (e.g., next day/week)
-
Return range: Expected return distribution (not a single number)
-
Volatility: How unstable price may be (risk forecasting)
-
Regime: “Risk-on vs risk-off” market state classification
That’s how professional markets think: not “the price will be 110k,” but “probability of upside regime is rising, volatility risk is X.”
Common model families used in predicting crypto prices with AI
Different model types solve different problems. A strong “best artificial intelligence crypto prediction” system often uses ensembles (several models combined), because no single method is robust across all regimes.

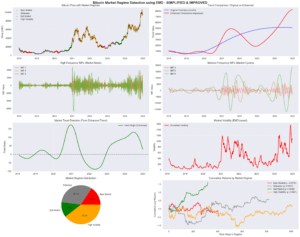
Layered AI architecture for regime detection, volatility forecasting, and dynamic risk allocation.
Source: Nature Scientific Reports (2025). Context adapted for crypto forecasting by Forvest.io
AI model types for crypto price prediction (practical view)
| Model family | Best for | Typical target | Strength | Common failure mode |
|---|---|---|---|---|
| Time-series statistical (ARIMA, GARCH) | Baselines, volatility | Volatility / mean reversion | Transparent, fast | Misses regime breaks |
| Tree models (XGBoost/LightGBM) | Mixed signals | Direction / return bucket | Strong with tabular features | Overfits feature leakage |
| Deep learning (LSTM/GRU/TCN) | Sequence patterns | Direction / range | Learns non-linear timing | Unstable across regimes |
| Transformers (time-series variants) | Multi-signal + context | Direction / range | Handles many inputs | Needs careful validation |
| Classification for regimes | Market state | Risk-on/off, trend/sideways | Great for risk control | Wrong labels = bad system |
| Ensemble / stacking | Robustness | Any above | Reduces single-model risk | Complexity hides errors |
The “right” choice depends less on hype and more on data quality and how you validate.
Signals that actually matter (and how AI uses them)
A serious crypto ai analysis stack combines multiple signal categories. Importantly, the value comes from how signals interact—not from one magic indicator.
Signal categories for AI crypto analysis (what they add and what they can’t)
| Signal category | Examples | What AI can learn | Main caveat |
|---|---|---|---|
| Market microstructure | volume, volatility, funding, open interest | crowd positioning + risk pressure | exchange data differs by venue |
| Price structure | returns, trend, drawdown, momentum | regime detection and timing | patterns change after big shifts |
| On-chain behavior | exchange flows, active addresses, realized metrics | investor vs speculator behavior | noisy; needs normalization |
| News & sentiment | headlines, social sentiment, macro calendar | event risk clustering | prone to spam/false signals |
| Cross-asset context | DXY, rates, equities, BTC dominance | macro coupling & decoupling | correlations are not stable |
If you want your pillar to rank and also be credible, you must explain these as inputs to a model, not as “signals that guarantee profits.”
A professional, investor-safe workflow (no hype)
Here’s a clean process that top financial sites implicitly follow when they talk about predicting crypto prices with AI:
-
Define the horizon: next day, next week, next month (don’t mix them).
-
Define the target:
-
Direction (Up/Down),
-
Range (expected band),
-
Volatility (risk),
-
or Regime (market state).
-
-
Build features carefully:
-
Use lagged data only (no future leakage),
-
align timestamps in UTC,
-
normalize across exchanges and market caps.
-
-
Validate like a pro:
-
Use walk-forward validation (rolling windows),
-
compare to simple baselines (e.g., “no-change” model),
-
track performance across bull/bear regimes.
-
In practice, volatility is easiest to interpret in a weekly format; the latest weekly crypto market recap shows how risk conditions actually printed on the chart.
-
Report uncertainty:
-
probabilities, confidence bands, and error ranges,
-
not absolute price targets.
-
-
Add risk controls:
-
prediction without risk framing is not analysis.
-
This workflow is exactly what separates “AI crypto forecast” content from real cryptocurrency price analysis with artificial intelligence.
What makes an AI crypto prediction claim trustworthy
Use this checklist inside your blog (it also helps SEO because it answers reader intent clearly):
-
Data transparency: what sources, what frequency, what assets?
-
Target definition: what exactly is being predicted?
-
Backtesting method: walk-forward, not random split.
-
Baseline comparison: did it beat naive models?
-
Regime robustness: does it work in both bull and bear?
-
Failure disclosure: when does it break?
If a page can’t answer these, it’s not “best AI crypto prediction”—it’s content marketing.
Quick note on ethics and expectations
This pillar is about analysis, not financial advice. AI can improve discipline and reduce noise, but it cannot remove tail risk or guarantee outcomes. The correct promise is:
AI helps you make your process more consistent, measurable, and auditable.
Part 2 — How to Evaluate AI Crypto Predictions (So You Don’t Get Tricked by “Accuracy”)
If Part 1 was about what AI prediction is, this part is about something more important: how to judge whether an AI crypto prediction is actually reliable.
Most “AI crypto prediction” pages look convincing because they show charts, confident language, and a few cherry-picked calls. The problem is that crypto is noisy, regimes shift, and a model can look great in one market phase and fail badly in another. So the only professional way to evaluate a model is through clear targets, correct backtesting, and the right metrics.
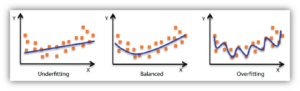
Many AI crypto prediction systems fail due to overfitting—where the model memorizes noise instead of learning stable market structure.
Source: Machine learning bias–variance illustration (conceptual).
This section gives you an investor-safe evaluation framework—no hype, no “signals,” just how a serious crypto analysis with AI system is validated.
1) Start by defining what “good prediction” means
Before metrics, you must lock three definitions:
-
Horizon: what time frame is the prediction for? (next hour, next day, next week)
-
Target: what output does the model give?
-
direction (up/down),
-
range (probability bands),
-
volatility (risk),
-
regime (risk-on/off).
-
-
Actionability: what would a user do with it?
-
reduce exposure,
-
rebalance,
-
hedge,
-
or simply monitor risk.
-
Without these, “accuracy” is meaningless because you might be judging the wrong thing.
Example:
A model that predicts “up” correctly 55% of the time can still be useless if losses on wrong calls are larger than gains on correct ones. That’s why finance rarely stops at raw accuracy.
2) The #1 mistake: validation that leaks the future
The biggest failure in predicting crypto prices with AI is improper testing. Many models look brilliant because they accidentally “see” the future through bad splits.
Here are the main leakage traps to avoid:
-
Random train/test split on time-series (invalid for markets).
-
Using indicators computed with future data (even indirectly).
-
Mixing timestamps from different sources (price vs on-chain vs news) without alignment.
-
Survivorship bias (testing only coins that still exist today).
-
Look-ahead labeling (targets that accidentally include future context).
A professional approach uses walk-forward testing.
3) Walk-forward backtesting (the only sane default)
Walk-forward (also called rolling or expanding window validation) matches reality:
-
Train on historical window A
-
Predict on future window B
-
Roll forward and repeat
That gives you performance across multiple market conditions, not just one lucky segment.
Good practice choices:
-
Use multiple windows (e.g., 6–12 months train → 1 month test, repeated).
-
Track results by regime (bull, bear, sideways).
-
Always compare to baselines (more on this below).
4) Metrics that matter (and metrics that mislead)
Different outputs need different metrics. Here’s the most practical way to think about it:
Evaluation metrics by prediction type (what to use, what to avoid)
| Prediction type | Good metrics | What it tells you | Misleading if used alone |
|---|---|---|---|
| Direction (Up/Down) | Precision/Recall, F1, Balanced Accuracy | true signal vs false alarms | plain Accuracy (especially with imbalance) |
| Return forecast | MAE/RMSE + hit-rate on sign | error size + direction | RMSE without distribution checks |
| Range / probability bands | Calibration (Brier score), coverage rate | whether probabilities are honest | “confidence” numbers without calibration |
| Volatility / risk | MAE on vol, correlation, tail error | risk forecasting quality | average error ignoring extremes |
| Regime classification | confusion matrix by regime, stability | robustness across phases | single overall score hiding regime failures |
Key idea: Markets punish bad downside calls more than they reward small wins, so you must track where the model fails—not just average performance.
5) Baselines: your model must beat something simple
A serious cryptocurrency price analysis with artificial intelligence page always checks baselines.
Baselines you should include internally (even if you don’t expose every detail publicly):
-
Naive forecast: “tomorrow = today”
-
Momentum baseline: “continue last trend”
-
Volatility baseline: simple rolling volatility
-
Simple technical rule: e.g., moving average direction
If your AI model can’t consistently beat these (after costs and slippage assumptions if applicable), it’s not adding real value.
6) Regime robustness: the hidden test that separates pros from amateurs
Crypto is a regime machine. A model trained in a bull phase often learns “buy the dip always works.” Then the bear phase arrives and the same logic becomes a drawdown engine.
So you should segment performance:
-
Bull: trending up, dips recover quickly
-
Bear: risk-off, rallies fade
-
Sideways: chop, false breakouts
-
High-volatility shock: liquidation cascades, news spikes
A model that looks “accurate” overall can actually be dangerous if it fails systematically in one regime (especially bear/high-volatility).
Segmenting crypto performance by regime (bull, bear, sideways, volatility shock) reveals whether an AI model is truly robust or simply optimized for one phase.
Source: Regime detection visualization (EMD-based market regime model example).
7) Probability calibration (the most ignored “AI” topic)
Many AI tools output probabilities like “BTC has a 72% chance to go up.” That number is only useful if it’s calibrated.
A calibrated model means:
When it says “70%,” it should be right about 7 times out of 10 over many cases.
Uncalibrated probabilities create false confidence and bad decisions.
Practical checks:
-
reliability plots (calibration curves)
-
Brier score (lower is better)
-
coverage tests for prediction intervals
This is how you turn an “AI crypto forecast” into something closer to professional risk modeling.
8) Don’t ignore costs: friction kills fragile models
Even if your content isn’t about trading, evaluation should acknowledge friction:
-
spreads,
-
fees,
-
funding costs (if using derivatives),
-
slippage in volatility spikes.
A prediction model that only works when conditions are perfect is not robust. In crypto, the best models are often those that:
-
reduce exposure in bad conditions, and
-
avoid overreacting.
9) A clean, practical evaluation checklist
Use this as a “trust filter” inside your pillar (it also matches high-intent search queries):
-
Is the prediction target clearly defined (direction/range/vol/regime)?
-
Is validation walk-forward (not random split)?
-
Are data sources aligned by time (UTC) and frequency?
-
Are baselines included and beaten?
-
Is performance shown by regime (bull/bear/sideways)?
-
Are probabilities calibrated (if probabilities are used)?
-
Are failure cases disclosed?
“Green flags vs Red flags” when evaluating AI crypto prediction pages
| Green flags (credible) | Red flags (marketing) |
|---|---|
| Defines horizon + target precisely | “AI predicts the next price” with no definition |
| Walk-forward testing explained | random split backtest or no backtest details |
| Uses baselines + regime breakdown | only one overall “accuracy” number |
| Shows uncertainty/probabilities properly | guaranteed outcomes / confident price targets |
| Mentions limitations + failure modes | ignores bear markets and tail risk |
What this means for your pillar (and internal linking)
Since you want other posts to redirect into this pillar, this section is a perfect “anchor” for cluster links like:
-
“Best AI crypto prediction” (should point here for evaluation standards)
-
“Crypto price prediction with machine learning” (should point here for validation method)
-
“Cryptocurrency price analysis with artificial intelligence” (should point here for metrics + calibration)
Because this part answers the reader’s real question:
“Can I trust this AI prediction?”
Part 3 — Building an AI Crypto Price Prediction Pipeline (Data → Model → Monitoring)
This final part turns everything into a practical, professional blueprint: how an “AI crypto prediction” system is built end-to-end in a way that is realistic for crypto markets and safe for long-term, risk-aware decision making.
Instead of promising perfect forecasts, the focus stays on what strong financial teams actually do: structured inputs, disciplined validation, and continuous monitoring. Because market regimes shift, models can degrade, and uncontrolled confidence becomes a liability.
1) Define the product output (what you will publish)
Before touching data or modeling, clarify what your AI output is. For a public-facing blog (and for a tool like Fortuna/Forvest), the most defensible outputs usually fall into a few categories:
-
Direction probability (e.g., next-day up/down likelihood)
-
Range forecast (e.g., expected return band with uncertainty)
-
Volatility / risk forecast (e.g., expected volatility regime)
-
Regime classification (risk-on vs risk-off)
-
Confidence / uncertainty (calibrated, not vibes)
From an investor standpoint, the strongest “prediction” is often risk-aware rather than directional. As an example, “volatility likely rising, uncertainty high” is usually more actionable than a single price target.
2) Data layer: the three pillars of crypto prediction
In crypto, forecasts improve when you combine price data with market structure and context. However, that only works if the data is clean, aligned, and free of leakage.
A robust data stack usually includes:
A) Market data
-
OHLCV (spot, and derivatives if relevant)
-
Funding rates and open interest (OI)
-
Liquidations and volatility indices (when available)
-
Order book snapshots (optional; heavy to maintain)
B) On-chain and flow context (optional but powerful)
-
Exchange inflows/outflows (netflow)
-
Stablecoin supply changes / exchange reserves
-
Whale activity, active addresses, realized metrics (only when they match the thesis)
C) Narrative / attention signals (use carefully)
-
News intensity and sentiment indexes
-
Google Trends or social activity proxies
-
Event markers (ETF headlines, major hacks, macro releases)
More data does not automatically mean better performance. In fact, extra sources increase both leakage risk and misalignment bugs, so quality usually beats quantity.
3) Feature engineering: what usually works (and what often fails)
Most production-grade systems rely on features that remain stable across regimes. Therefore, start with simple, interpretable signals and expand only when you can prove durability.
Signals that tend to be useful include:
-
Returns across multiple horizons (1h, 4h, 1d, 1w)
-
Volatility features (realized volatility, ATR-like measures)
-
Trend + mean-reversion (moving averages, z-scores)
-
Market structure (OI changes, funding deviations, liquidation spikes)
-
Regime features (vol expansion, correlation shifts, range compression/expansion)
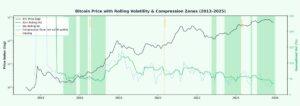
Bitcoin price (log scale) with 6M and 12M rolling volatility and volatility compression zones. These features are commonly used in regime-aware crypto forecasting systems.
Source: Historical BTC data visualization (2013–2025).
In contrast, these patterns often fail:
-
Overfitting to dozens of indicators with weak economic meaning
-
Using complex feature sets without stability testing
-
Injecting sentiment signals without calibration (they can invert across regimes)
4) Model selection: choose boring, win long-term
A practical strategy is to begin with strong baselines and only escalate complexity when the evidence supports it. As a result, you’ll avoid “fancy but fragile” systems.
A good progression looks like this:
-
Baselines: naive, momentum, volatility baseline
-
Linear models: ridge/lasso, logistic regression (surprisingly strong with good features)
-
Tree ensembles: XGBoost/LightGBM (often top performers for tabular market features)
-
Sequence models: LSTM/Temporal CNN/Transformers (only if you truly need them and can control overfitting)
Because crypto is non-stationary, “smart but simple” plus monitoring often outperforms sophisticated models that break silently.
5) Training and validation: walk-forward by default
To avoid misleading results, time-series evaluation is non-negotiable. Specifically:
-
Use time-based splits only
-
Use walk-forward evaluation (rolling or expanding window)
-
Evaluate by market regime (bull/bear/sideways/high-vol)
-
Compare against baselines every time
Additionally, test:
-
stability over time (does performance decay?)
-
sensitivity to parameter changes
-
feature importance drift (which signals stop working?)
6) Post-processing: make predictions usable (and honest)
Raw model outputs usually need refinement. For instance, probabilities often require calibration to match real-world frequencies.
Common post-processing steps include:
-
Probability calibration (for classification outputs)
-
Prediction intervals (for range forecasts)
-
Uncertainty flags when the model is out-of-distribution
A high-integrity output might look like:
-
“Direction: 58% up (calibrated)”
-
“Expected daily move range: -2.1% to +2.7%”
-
“Risk regime: Elevated (vol expansion)”
-
“Confidence: Low (model uncertainty high)”
This is generally more credible than an exact price target.
In practice, regime shifts are a risk-management problem first, not a prediction problem—our risk management framework covers how to treat these transitions as exposure and sizing decisions.
7) Monitoring in production: the part most blogs ignore
In practice, prediction systems require monitoring because exchanges change microstructure, liquidity shifts, correlations rotate, and macro regimes reshape behavior. Consequently, a model that worked last quarter can degrade quickly.
In practice, prediction systems need monitoring because market structure changes. Exchanges shift microstructure, liquidity moves, correlations rotate, and macro regimes evolve—so a model that worked last quarter can degrade fast.
A monitoring layer should track:
-
Data quality: missing values, timestamp drift, outliers
-
Feature drift: distribution changes vs training period
-
Performance drift: rolling hit-rate, calibration decay
-
Regime alarms: shock detection (liquidations, volatility spikes)
When drift is detected, retraining is one option. Alternatively, you can down-weight unstable features or throttle confidence until stability returns.
8) Practical blueprint: what to build first (minimal → robust)
If you want a credible “AI crypto prediction” workflow, build in phases. That approach keeps quality high while expanding coverage.
Phase 1 — Minimum viable, high integrity
To begin, keep the scope narrow and measurable:
-
1–2 assets (BTC/ETH)
-
daily horizon (less noisy than hourly)
-
direction probability + volatility regime
-
walk-forward validation + baselines
Phase 2 — Better coverage
Next, expand carefully while protecting data integrity:
-
multi-horizon outputs (1d + 1w)
-
on-chain/flow features (carefully aligned)
-
calibration + regime breakdown charts
Phase 3 — Production-grade
Finally, treat the system like a maintained product, not a one-off model:
-
monitoring dashboards
-
drift detection + retraining policy
-
model versioning + audit logs (what changed and when)
End-to-end pipeline checklist (what “good” looks like)
| Layer | What you build | What “done right” looks like |
|---|---|---|
| Output definition | target + horizon + format | precise target, clear uncertainty |
| Data | market + optional on-chain + context | aligned timestamps, no leakage |
| Features | returns, vol, structure, regime | interpretable, stress-tested |
| Model | baseline → ensembles → sequence (optional) | beats baselines across regimes |
| Validation | walk-forward | regime breakdown + calibration |
| Post-processing | calibration + intervals | probabilities match reality |
| Monitoring | drift + performance | detects decay before users suffer |
Bullet list — Common failure points (avoid these)
-
Random train/test split on time-series
-
No baselines (can’t prove real value)
-
No regime testing (model collapses in bear markets)
-
No calibration (probabilities look confident but lie)
-
Too many indicators (overfitting disguised as sophistication)
-
No monitoring (performance rots silently)
Conclusion: what “Analyze Cryptocurrencies with AI” should actually promise
A professional AI crypto prediction system doesn’t promise certainty. Instead, it promises structure: clearer inputs, disciplined validation, honest uncertainty, and continuous monitoring. As a result, the user gets a framework that stays reliable even when the market gets noisy.
For internal linking, the pillar logic stays clean:
-
posts about “machine learning crypto prediction” → link to Part 3 (pipeline + validation)
-
posts about “best AI crypto prediction” → link to Part 2 (evaluation + red flags)
-
posts about “crypto analysis with AI tools” → link to Part 3 (data + monitoring)
This completes the pillar with a finance-grade workflow, without turning it into investment advice.