

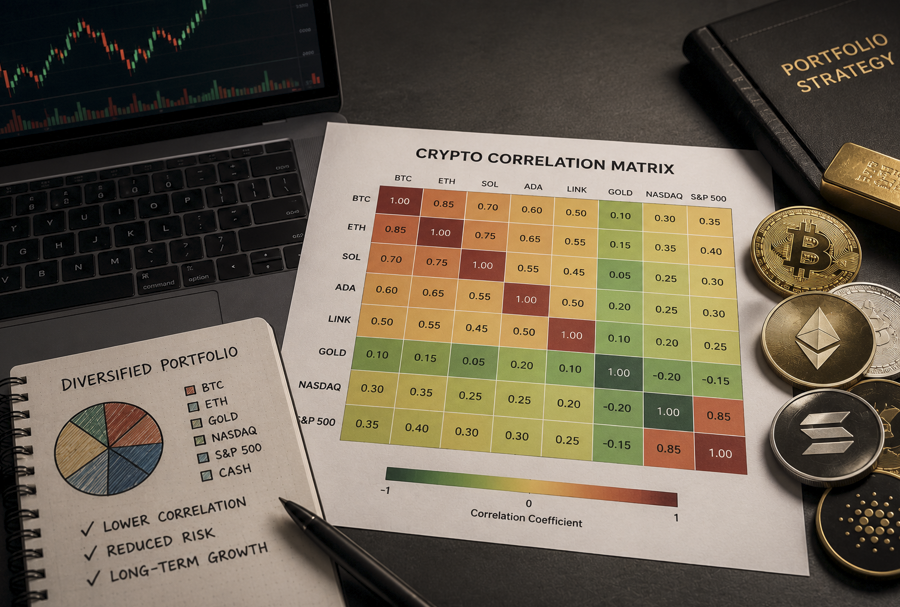
Crypto correlation measures the historical co-movement of cryptocurrencies and other financial assets over a selected period. Investors use it to evaluate diversification, concentration risk, and changing market relationships rather than predict future cryptocurrency prices. The result describes a historical relationship whose strength can change as market conditions evolve.
A portfolio with ten cryptocurrencies may still behave like a single investment.
Many investors assume that holding several digital assets automatically creates diversification. In reality, Bitcoin, Ethereum, and large-cap altcoins can respond to many of the same market forces. They may rise and fall together during similar conditions. A portfolio can therefore appear diversified by asset count while remaining heavily exposed to shared risk drivers.
Investors often use a crypto correlation tool, correlation matrix, or correlation heatmap to compare these relationships. Such tools show whether assets have historically moved together, moved in opposite directions, or displayed no consistent linear relationship. They can support diversification analysis, but they do not provide guaranteed outcomes or reliable price predictions.
Investors managing multiple holdings can also monitor portfolio behavior alongside Portfolio Management to evaluate how correlation fits into broader allocation decisions.
Key Takeaways
- Correlation measures historical relationships, not future price direction.
- Diversification depends on asset behavior, not only the number of holdings.
- Correlations can change across timeframes and market regimes.
- A crypto correlation matrix can reveal hidden concentration risk.
- Investors should interpret correlation alongside volatility, liquidity, fundamentals, and portfolio objectives.
Why Crypto Correlation Matters for Investors
Correlation matters because the number of assets in a portfolio does not reveal how independent those exposures actually are. Investors can use correlation analysis to identify shared behavior, compare risk drivers, and evaluate whether additional holdings improve diversification or simply duplicate exposure already present elsewhere.
Bitcoin’s relationship with equities, gold, technology stocks, and other cryptocurrencies has varied across different periods. Institutional research has documented changing relationships between Bitcoin and traditional asset classes, which reinforces why investors should avoid treating one historical coefficient as permanent.
A correlation coefficient summarizes the relationship between two assets on a scale from -1 to +1. Values closer to +1 indicate stronger same-direction movement. Readings closer to -1 indicate that the assets have more often moved in opposite directions. A result near zero suggests a weak linear relationship over the selected dataset.
However, every coefficient depends on the timeframe, data source, and sampling method used. A 30-day reading may differ from a 90-day or one-year result. Investors should therefore interpret each figure as a time-specific observation rather than a permanent description of an asset pair.
| Common Investor Assumption | Better Interpretation |
|---|---|
| More crypto holdings create diversification | Examine whether the assets share similar behavior and risk drivers. |
| One coefficient defines the relationship | Compare several timeframes and review the calculation method. |
| Low correlation means low risk | Evaluate volatility, liquidity, and potential drawdowns separately. |
This distinction matters because investors often confuse diversification with variety. Owning more assets can increase variety without creating meaningful independence. If several holdings respond to the same liquidity conditions, sentiment shifts, or regulatory events, they may continue behaving like one concentrated exposure.
Diversification Is More Than Holding Multiple Assets
Consider an investor who owns Bitcoin, Ethereum, Solana, and several AI-related crypto tokens. The portfolio appears diversified because it includes different projects and market categories. Yet during a broad decline, these holdings may move in the same direction and lose value at similar times.
This is where behavioral diversification becomes useful. Behavioral diversification asks whether holdings actually respond differently when market conditions change. It goes beyond counting assets and examines the relationships among them.
Forvest’s Behavioral Diversification Framework evaluates diversification through three connected perspectives:
Asset variety considers how many holdings the portfolio contains. Behavioral independence examines whether those holdings have historically moved differently. Risk-driver diversity asks whether the assets depend on separate underlying economic and market forces.
Two cryptocurrencies may have different technologies and use cases but still rely on similar risk drivers. These may include crypto-wide liquidity, leverage, investor risk appetite, or Bitcoin-led sentiment. When the same forces influence most holdings, the portfolio may contain fewer independent exposures than its asset list suggests.
Correlation analysis helps investors identify these relationships and reveal potential concentration. However, it remains only one input within a broader portfolio process. Investors must also consider volatility, liquidity, fundamentals, constraints, and personal objectives.
A crypto correlation matrix can make relationship analysis easier by comparing several asset pairs within one grid. A heatmap can then highlight stronger and weaker relationships visually. The detailed mechanics of matrices, heatmaps, and coefficient ranges will be examined separately rather than treated as complete portfolio instructions here.
Correlation Changes Across Market Conditions
Crypto correlations are not fixed. Relationships may strengthen, weaken, or reverse as liquidity, monetary conditions, regulation, volatility, and investor behavior change.
Bitcoin may move more closely with technology stocks during one period and behave more independently during another. Research and institutional market commentary have documented how Bitcoin’s relationship with equity risk assets can shift materially over time.
Relationships among crypto assets can also become more concentrated during periods of market stress. When investors reduce risk across multiple positions, assets that previously behaved differently may begin moving in the same direction. However, the strength and duration of this convergence depend on the assets, timeframe, and type of stress involved.
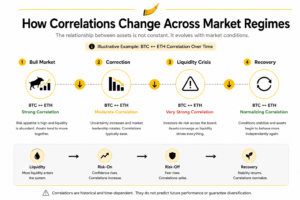
Investors can examine rolling correlation to observe these changes. Instead of producing one fixed figure for an entire period, rolling analysis recalculates the relationship through overlapping windows. It can reveal whether a relationship is strengthening, weakening, reversing, or becoming less stable.
A static one-year coefficient may hide shorter episodes of close co-movement. For example, two assets may display a moderate annual relationship but move closely together during a liquidity shock. That temporary convergence can reduce diversification when investors expect it to provide the most protection.
Rolling correlation adds historical context, not predictive certainty. The article will examine its calculation, timeframes, and interpretation in greater detail within the dedicated market-regime section.
Correlation Supports Portfolio Decisions, Not Price Predictions
One of the biggest misconceptions about crypto correlation is that it predicts future market direction.
It does not.
Correlation measures historical co-movement. It cannot explain why two assets moved together, establish causation, determine intrinsic value, or forecast future returns. A strong relationship today does not guarantee that the same pattern will continue.
Investors can instead use correlation as a portfolio-diagnostic input. It may help them assess whether several holdings share the same risks, whether diversification has weakened, or whether adding another cryptocurrency would introduce a genuinely different exposure.
Combining correlation analysis with Trust Score can provide additional context when evaluating the overall quality and reliability of portfolio holdings.
Correlation becomes more useful when combined with volatility analysis, liquidity evaluation, technical market analysis, and fundamental research. Each method answers a different question. Correlation describes relationships, while other tools examine movement size, market structure, asset quality, and downside risk.
Forvest approaches crypto correlation from this broader perspective. The objective is not to forecast where cryptocurrency prices will move next. It is to help investors evaluate behavioral diversification, concentration risk, and changing market relationships with better context.
But how do investors measure these relationships in practice, and what can a crypto correlation matrix reveal that individual price charts cannot?
How a Crypto Correlation Matrix Works (With Example)
A crypto correlation matrix is a table that compares historical relationships between multiple assets using correlation coefficients. Investors use it to evaluate diversification, concentration risk, and asset correlation across a portfolio rather than predict future market movements.
Instead of reviewing one asset pair individually, the matrix organizes correlation coefficients into a structured grid. This makes it easier to identify shared market behavior, compare multiple assets simultaneously, and detect potential concentration risk within a portfolio.
Each row and column represents an asset, while every intersecting cell displays the historical correlation coefficient between the two. Most crypto correlation tools calculate this relationship using the Pearson correlation coefficient, which measures the strength of historical linear co-movement between two assets.
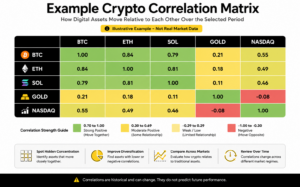
Values closer to +1 indicate that the assets have generally moved in the same direction during the selected period. Values closer to −1 suggest they have often moved in opposite directions, while readings near 0 indicate a weak or limited historical relationship.
Although the format appears simple, interpreting a correlation matrix requires context.
A coefficient summarizes historical price behavior, but it does not explain why the relationship exists or whether it will continue. Changes in liquidity, macroeconomic conditions, market sentiment, or regulation can all influence how assets behave over time.
Understanding a Crypto Correlation Matrix
The following framework shows how investors commonly interpret correlation ranges without treating them as trading signals.
| Correlation Range | Historical Relationship | Investor Interpretation | Investor Action | Important Limitation |
|---|---|---|---|---|
| +0.70 to +1.00 | Strong positive correlation | Assets have generally moved together | Avoid assuming the holdings provide independent diversification. | The relationship may weaken over time. |
| +0.30 to +0.69 | Moderate positive correlation | Some shared market behavior | Review whether additional assets improve diversification. | Correlation varies across different periods. |
| -0.29 to +0.29 | Weak or limited correlation | Assets have behaved relatively independently | Evaluate whether diversification benefits improve alongside other risk measures. | Weak correlation does not eliminate portfolio risk. |
| -0.30 to -1.00 | Negative correlation | Assets have often moved in opposite directions | Analyze whether the relationship remains consistent across different market conditions. | Negative relationships can also change. |
These ranges provide a useful reference point, but they should never be interpreted as fixed rules. Different data providers may use different calculation methods, observation periods, sampling frequencies, or rolling window settings, resulting in slightly different correlation values for the same asset pair.
An additional consideration is how correlations are distributed across the entire portfolio. Two portfolios can display a similar average correlation while having very different concentration risk because relationships are distributed differently across individual holdings. This distinction helps investors evaluate the true diversification benefit of a portfolio instead of relying on a single average statistic.
Why Crypto Correlation Tools Compare Multiple Timeframes
One of the most common mistakes investors make is relying on a single timeframe.
For example, Bitcoin and Ethereum may display a relatively high correlation over the past year while showing noticeably different behavior during the previous 30 days. Likewise, Bitcoin correlation matrix data may show a stronger relationship with the Nasdaq during one market cycle and a weaker relationship during another.
For this reason, many crypto correlation tools allow investors to compare multiple periods, such as 30-day, 90-day, and one-year correlations, instead of relying on a single historical snapshot. This broader view helps investors identify whether an asset correlation is becoming stronger, weaker, or remaining relatively stable over time.
Common Mistakes When Reading a Crypto Correlation Matrix
A crypto correlation matrix provides valuable historical context, but it is often misunderstood. Many investors focus only on the numbers while ignoring the market conditions behind them. This can lead to poor portfolio decisions and unrealistic expectations about diversification.
One of the most common mistakes is treating correlation as a prediction tool. A strong positive correlation does not mean two assets will continue moving together, just as a negative correlation does not guarantee they will move in opposite directions in the future. Correlation summarizes historical market behavior rather than forecasting future outcomes.
Another mistake is relying on a single coefficient without considering the selected timeframe. Two assets may appear weakly correlated over one year while showing a much stronger relationship during the past month. Looking at only one period can therefore hide meaningful changes in market behavior.
Investors also sometimes assume that low correlation automatically means lower portfolio risk. In practice, correlation measures the relationship between assets, not the quality of the investment itself. An asset with low correlation may still experience high volatility, limited liquidity, or significant downside risk.
An additional consideration is correlation breakdown. Relationships that appear stable during normal market conditions may weaken, strengthen, or temporarily reverse during periods of elevated volatility. Understanding when correlations become less reliable is just as important as measuring them.
These examples highlight why correlation should be interpreted within a broader investment framework rather than as an isolated statistic.
What a Good Crypto Correlation Tool Should Provide
Not all crypto correlation tools deliver the same level of insight. Some display only a single historical coefficient, while others provide a more comprehensive view of changing market relationships and potential diversification benefits.
A practical crypto correlation tool should allow investors to compare multiple assets across different timeframes instead of relying on one static value. Viewing 30-day, 90-day, and one-year correlations helps identify whether relationships are strengthening, weakening, or remaining relatively stable.
The most useful tools also present information through a correlation matrix and heatmap. A matrix makes it easier to compare many assets simultaneously, while a heatmap allows investors to identify stronger and weaker relationships at a glance without manually reviewing every coefficient.
Another important feature is transparency. Investors should understand how correlation values are calculated, how frequently the data is updated, and which exchanges or pricing sources are used. Without this context, identical asset pairs may produce different correlation values across different platforms.
A comprehensive correlation tool should also allow comparisons beyond cryptocurrencies. Evaluating Bitcoin alongside the S&P 500, Nasdaq, or gold helps investors understand how digital assets interact with broader financial markets instead of viewing crypto as an isolated asset class.
More importantly, a useful tool should help investors evaluate diversification benefit, not simply display correlation values. Two portfolios can show similar average correlations while exposing investors to very different concentration risk because the relationships among individual holdings are distributed differently.
Practical Applications for Portfolio Analysis
Correlation analysis becomes more valuable when it supports real portfolio decisions rather than simply describing market relationships.
For example, an investor considering the addition of a new cryptocurrency can evaluate whether the asset introduces genuinely different behavior or simply increases exposure to risks already present within the portfolio.
Similarly, investors reviewing existing allocations can use a correlation matrix to identify clusters of highly related assets. This process may reveal hidden concentration that is not obvious when looking only at asset names or sector classifications.

Correlation can also help investors monitor how diversification changes over time. As market conditions evolve, assets that previously behaved independently may begin moving together, reducing the diversification benefits that once existed.
These practical applications demonstrate why correlation is best viewed as a portfolio research tool instead of a market timing indicator.
Rather than answering “Which asset will perform best?”, correlation helps investors answer a more useful question:
“How are my investments behaving together, and are they still providing meaningful diversification as market conditions evolve?”
If correlations can strengthen, weaken, or even break down over time, how can investors determine when diversification is genuinely protecting a portfolio rather than creating a false sense of security? This question leads directly into the next section, where we examine how changing market regimes influence correlation, concentration risk, and long-term portfolio construction.
Using Crypto Correlation Within a Portfolio Decision Framework
Understanding crypto correlation becomes most valuable when it supports better portfolio decisions rather than serving as an isolated statistic. Correlation analysis explains how assets have historically behaved relative to one another, but meaningful investment research requires combining those relationships with portfolio construction, asset allocation, and changing market conditions.
Forvest approaches this process through a Behavioral Diversification Framework, which focuses on how investments behave together instead of simply counting the number of assets within a portfolio.
Rather than asking, “How many cryptocurrencies do I own?”, investors can ask a more useful question:
“Do my holdings actually respond differently when market conditions change?”
Answering that question often provides a clearer picture of crypto diversification than asset count alone.
The Behavioral Diversification Framework
The framework follows four practical steps that investors can apply as part of an ongoing portfolio review process.
| Step | Objective | Investor Focus |
|---|---|---|
| 1. Measure Correlation | Analyze historical relationships using a crypto correlation matrix. | Which assets consistently move together? |
| 2. Identify Shared Risk Drivers | Evaluate whether holdings react to the same macroeconomic, liquidity, or sentiment factors. | Are exposures truly independent? |
| 3. Evaluate Diversification Benefit | Assess whether new assets improve portfolio diversification or simply duplicate existing exposure. | Does this allocation strengthen portfolio construction? |
| 4. Monitor Market Regimes | Review how relationships evolve across different market environments. | Has correlation changed enough to affect portfolio optimization? |
Unlike a one-time correlation calculation, this framework treats correlation analysis as a continuous monitoring process. Relationships between assets evolve as liquidity, regulation, monetary policy, institutional participation, and investor sentiment change. Reviewing correlations periodically helps investors recognize whether diversification is improving or gradually weakening over time.
An important implication of this framework is that two portfolios with identical average correlation values may still require completely different risk decisions. Concentration depends on how correlations are distributed across individual holdings—not simply on the average coefficient. A portfolio containing several tightly connected assets may carry greater downside exposure than another portfolio with a similar average correlation but more independent relationships. Understanding this distribution provides a deeper perspective on portfolio construction than looking at summary statistics alone.
Correlation Is One Input—Not the Entire Investment Process
Although correlation provides valuable insight, it should never become the only factor guiding investment decisions.
Professional investors generally combine correlation analysis with several complementary perspectives, including volatility analysis, liquidity assessment, asset allocation, fundamental research, and risk-adjusted return evaluation. Each answers a different question about portfolio quality.
For example, a cryptocurrency may improve diversification because it has historically shown a lower relationship with existing holdings. However, that same asset may introduce additional liquidity constraints or higher volatility that influence its overall role within a portfolio. Likewise, an asset with a higher historical correlation may still support long-term objectives if it contributes to a broader investment strategy.
This broader perspective shifts the conversation away from finding a “perfect” correlation value and toward building a more resilient portfolio under different market regimes.
Final Thoughts
Crypto correlation helps investors evaluate historical relationships between digital assets to better understand portfolio diversification, concentration risk, and asset allocation. Rather than predicting future prices, it provides context for how investments have behaved across different market environments and supports more informed portfolio construction.
A crypto correlation matrix, correlation heatmap, or crypto correlation tool can simplify this analysis by organizing complex market relationships into a structured format. Their value does not come from forecasting returns. Instead, they help investors evaluate whether holdings genuinely contribute to diversification or simply increase exposure to the same underlying market forces.
The strongest portfolios are not necessarily those holding the greatest number of assets, but those built on genuinely diversified market behavior. By combining correlation analysis with volatility, liquidity, fundamental research, portfolio optimization, and disciplined risk management, investors can develop a more complete understanding of portfolio resilience as financial markets continue to evolve.
The strongest portfolios are not necessarily those holding the greatest number of assets, but those built on genuinely diversified market behavior. By combining correlation analysis with volatility, liquidity, Crypto Technical Analysis, fundamental research, portfolio optimization, and disciplined risk management, investors can develop a more complete understanding of portfolio resilience as financial markets continue to evolve.
Disclaimer
Crypto correlation reflects historical relationships between assets and should not be interpreted as a predictor of future market performance or investment outcomes. Correlations may strengthen, weaken, or reverse as economic conditions, liquidity, regulation, and investor behavior change.
Correlation analysis is one component of a broader investment research process. Investors should consider portfolio objectives, asset allocation, volatility, liquidity, and individual risk tolerance before making investment decisions. Cryptocurrency markets remain highly volatile, and historical relationships do not guarantee future results.