Volume & Market Participation in Crypto: OBV, Volume Profile & Smart Money Signals
How to Read Volume, Liquidity, and Participation Without Overtrading

- I. Volume Foundations + OBV + the start of Volume Profile
- II. Foundation (what volume is, and why it fools people)
- A) What volume is (and what it represents)
- B) Why traditional volume reading is misleading
- same volume, different meaning
- III. Core Indicator #1 — OBV (On-Balance Volume)
- What OBV is (origin + idea)
- How OBV is calculated (plain language)
- How professionals use OBV (4 uses)
- A simple Bitcoin-style example (around $29k)
- OBV mistakes to avoid
- Core Indicator #2 — Volume Profile (start)
- III. Core Indicator #2 — Volume Profile (complete)
- What Volume Profile is (and why it’s different)
- The 4 profile terms you must know
- Professional uses (5)
- Bitcoin-style example: $29k–$31k consolidation
- III. Core Indicator #3 — A/D Line (Accumulation/Distribution)
- What A/D measures
- Why A/D is useful in crypto
- 3 professional uses
- Quick altcoin-style example (gap-like behavior)
- Mistakes to avoid
- III. Core Indicator #4 — VWAP (Volume-Weighted Average Price)
- What VWAP is
- How to use VWAP professionally (4)
- A simple rule-set (not a signal)
- Indicator comparison table (required)
- IV. Smart Money (Wyckoff + Liquidity, without the hype)
- A) Wyckoff phases (how volume maps the story)
- B) Liquidity zones (why fakeouts happen)
- V. Practical application (confluence that actually works)
- Multi-timeframe hierarchy (simple and effective)
- Confluence matrix
- Three real-use examples (templates)
- VI. Mistakes (and when NOT to use volume)
- VII. 2025 context (why volume reading changed)
- VIII. Conclusion (keep it simple)
I. Volume Foundations + OBV + the start of Volume Profile
Most crypto traders focus on price. But there’s a more powerful signal they’re missing: volume.
Price tells you where the market moved. Volume hints at who pushed it—and whether the move had real participation behind it. In 2025, that matters because access is broader and short-term flows are heavily bot-driven.
Drop this misconception: high volume ≠ bullish. High volume can mean panic selling, liquidation cascades, or distribution. The key question is not “Is volume high?” It’s “Does volume support the story of the move?”
In this cluster guide you’ll learn participation with four tools:
-
OBV for confirmation and divergence
-
Volume Profile for value zones, acceptance, and rejection
-
A/D Line for close-location pressure
-
VWAP for institutional “fair price” benchmarking
You’ll also learn Wyckoff phases and liquidity sweeps—without the hype.
Technical indicators are often treated as signal generators, but in reality, they serve different roles. Some measure trend, others momentum, volatility, or participation.
In our crypto technical indicators guide, we explained how indicators should be grouped by function rather than stacked blindly. This article builds on that framework by focusing specifically on volume and market participation—the layer that explains who is active, not just where price moved.
II. Foundation (what volume is, and why it fools people)
A) What volume is (and what it represents)
Volume is the amount traded in a given period. In crypto, that can be spot volume, perp volume, or DEX activity. Treat volume as a participation meter:
-
Strong participation can validate a breakout.
-
Thin participation can expose a move as fragile.
-
Participation often shifts before price changes character.
Volume is not a directional compass. The same volume level can produce opposite outcomes depending on context.
Example: two hourly candles print identical volume.
-
Candle A: price breaks a range high and closes strong → demand likely supported.
-
Candle B: price spikes into resistance and closes weak → sellers may be absorbing.
So, volume isn’t “bullish” or “bearish.” Volume is evidence—you still need structure.
B) Why traditional volume reading is misleading
“Volume up = bullish” fails in crypto for four reasons:
-
Inflated or noisy prints
Some pairs/venues can show distorted activity. -
Timing
Volume often spikes after the move. Chasing spikes is how you arrive late. -
Fragmentation
Spot, perps, and DEXs can disagree. -
Regime dependence
In trends, rising volume can support continuation. Near extremes, it can signal distribution or capitulation.
That’s why pros use volume indicators: they turn raw volume into interpretable patterns.
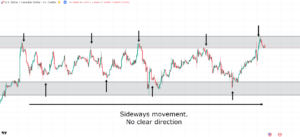
Source: TradingView (OANDA – USDCAD, 1H)
same volume, different meaning
| Situation | Price behavior | Typical interpretation | What to check next |
|---|---|---|---|
| Breakout + strong close | Closes near highs | Participation supports move | Retest + OBV trend |
| Breakout + weak close | Wick, closes mid/low | Absorption / possible trap | Profile value zone |
| Down move + volume climax | Sharp drop, then stall | Capitulation risk | Wyckoff Phase A signs |
| Up move + volume climax | Vertical spike | Late FOMO / distribution | Liquidity sweep risk |
III. Core Indicator #1 — OBV (On-Balance Volume)
What OBV is (origin + idea)
OBV was popularized by Joseph Granville in the 1960s. The premise: if volume is “voting power,” OBV tracks whether that power is flowing into up-closes or down-closes over time.
How OBV is calculated (plain language)
OBV is a running total:
-
If the candle closes up, add that period’s volume.
-
If it closes down, subtract that period’s volume.
-
If it closes flat, OBV doesn’t change.
OBV doesn’t care about candle size. It cares about the direction of the close.
How professionals use OBV (4 uses)
1) Trend participation confirmation
Price up + OBV up = participation aligned. Misalignment is where risk grows.
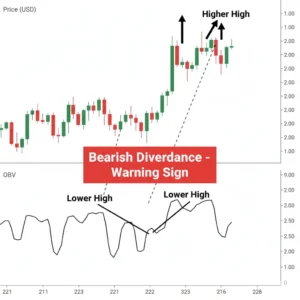
2) Divergence (highest value)
Price makes a new extreme but OBV fails to confirm:
-
Higher high in price + lower high in OBV → demand may be fading.
-
Lower low in price + higher low in OBV → selling pressure may be weakening.
Treat divergence as a warning. Demand extra confirmation (structure break, reclaim, or a clean retest).
3) Breakout validation
If price breaks a range and OBV also breaks its local structure, the breakout is more credible. If OBV stays flat, the move may be positioning-driven.
4) Range diagnosis (accumulation vs distribution feel)
Rising OBV while price is flat can suggest accumulation; falling OBV can suggest distribution.
A simple Bitcoin-style example (around k)
Assume BTC chops near $29k and briefly breaks above the range. If OBV does not print a new swing high, treat the breakout as “unproven.” A disciplined approach:
-
wait for a clear close above the range,
-
confirm OBV makes a new swing high,
-
invalidate back inside the range.
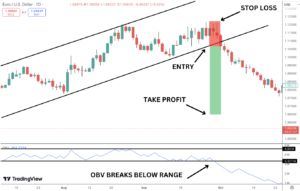
Source: TradingView
OBV mistakes to avoid
-
Using OBV on illiquid coins where volume is random
-
Calling every divergence a reversal
-
Ignoring support/resistance and focusing only on the line
Core Indicator #2 — Volume Profile (start)
Volume Profile answers a different question than OBV: Where did the market accept price as “fair” based on traded volume? Instead of volume over time, it maps volume across price levels. Next, you’ll learn POC, Value Area, and HVN/LVN, and how they turn chaotic candles into a readable participation map. You’ll see why profiles often explain why breakouts fail, where retests matter, and how institutions manage entries around value instead of emotion in fast crypto conditions.
III. Core Indicator #2 — Volume Profile (complete)
What Volume Profile is (and why it’s different)
Regular volume bars tell you how much traded in a period. Volume Profile tells you where it traded, by stacking volume at each price level. That “where” matters because crypto often revisits the same value zones—areas where buyers and sellers previously agreed on price.
Think of Volume Profile as a map of acceptance vs. rejection:
-
Acceptance: price spends time and trades heavy volume (the market “likes” it).
-
Rejection: price moves quickly with little volume (the market “doesn’t like” it).
The 4 profile terms you must know
-
POC (Point of Control): the single price level with the most traded volume.
-
Value Area (VA): the range that contains most of the traded volume (often ~70% depending on platform settings).
-
VAH / VAL: the upper and lower boundaries of the value area.
-
HVN / LVN: High-Volume Nodes (thick areas) and Low-Volume Nodes (thin areas).
A clean way to interpret it:
-
HVNs behave like “sticky” zones where price slows down.
-
LVNs behave like “fast” zones where price can travel quickly.
Professional uses (5)
-
Identify “fair value” zones
If price is inside value, mean-reversion behavior is common. -
Define real support/resistance
VAH/VAL and major HVNs often act like structural barriers. -
Spot breakout quality
A breakout that accepts above VAH is stronger than one that immediately falls back into value. -
Plan retests
Retests into VAH/VAL often offer clearer invalidation than guessing a random candle low. -
Find “thin air” targets
If price breaks into an LVN, it may move rapidly until the next HVN.
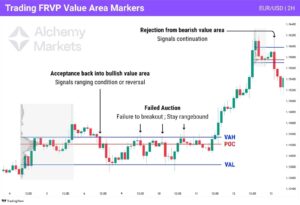
Source: TradingView
Bitcoin-style example: k–k consolidation
Imagine BTC rotates between $29k and $31k for days. The profile builds an HVN near the center (POC). If price breaks above $31k but can’t stay above VAH and slides back into value, that’s rejection. If price holds above VAH and volume builds there, that’s acceptance—a higher-quality move.
Practical rule:
If price returns to value after a breakout attempt, treat the move as “not accepted yet.”
III. Core Indicator #3 — A/D Line (Accumulation/Distribution)
What A/D measures
The Accumulation/Distribution (A/D) Line estimates whether volume is flowing into buying or selling pressure based on where the close lands inside the candle’s range.
It uses a simple idea:
-
Closing near the high suggests demand had control.
-
Closing near the low suggests supply had control.
A/D converts that into a “money flow” value and accumulates it over time, similar in spirit to OBV but more sensitive to close location.
Why A/D is useful in crypto
Crypto candles can be noisy. A/D helps you answer:
-
Did buyers defend the close, or did sellers push it down?
-
Is participation supporting the trend, or is it “hollow”?
3 professional uses
-
Trend confirmation: price up + A/D up = demand aligned.
-
Divergence detection: price makes a higher high while A/D stalls = potential distribution risk.
-
Range pressure reading: flat price + rising A/D can hint accumulation; falling A/D can hint distribution.
Quick altcoin-style example (gap-like behavior)
Some altcoins jump sharply, then drift sideways. If price holds the range but A/D trends down, it can indicate selling into strength. If price is flat while A/D trends up, it may indicate steady absorption of supply before continuation.
Mistakes to avoid
-
Using A/D without checking liquidity (thin pairs create misleading closes)
-
Treating one divergence as a guaranteed reversal
-
Ignoring key levels (A/D is not a replacement for structure)
III. Core Indicator #4 — VWAP (Volume-Weighted Average Price)
What VWAP is
VWAP is the average price weighted by volume. In plain terms, it answers:
“What price did the market actually trade the most value around?”
Institutions use VWAP as a benchmark for execution quality: buying below VWAP and selling above VWAP is a common performance lens, not a magic signal.

Source: TradingView (COMEX Gold Futures)
How to use VWAP professionally (4)
-
Fair price reference
In a choppy market, VWAP often behaves like a “gravity line.” -
Bias filter
Above VWAP with support = bullish bias; below VWAP with resistance = bearish bias. -
Pullback planning
In trends, pullbacks toward VWAP can offer cleaner risk definitions than random moving averages. -
Intraday discipline
VWAP shines on intraday/sessions; it keeps you from chasing extended moves.
A simple rule-set (not a signal)
-
Buy setups: price reclaims VWAP and holds; invalidate on loss and rejection.
-
Sell/short setups: price loses VWAP and fails to reclaim; invalidate on reclaim.
Indicator comparison table (required)
| Tool | Best for | Core question it answers | Common misuse |
|---|---|---|---|
| OBV | Participation confirmation | Is volume aligned with the trend? | Calling every divergence a reversal |
| Volume Profile | Value zones | Where is price accepted vs rejected? | Ignoring VAH/VAL and chasing candles |
| A/D Line | Close-location pressure | Did buyers/sellers control the close? | Using on illiquid pairs |
| VWAP | “Fair price” benchmark | Is price extended vs value? | Treating VWAP as a standalone entry signal |
With these four tools, you can separate real participation from noise. Next, we’ll connect them to Wyckoff phases and liquidity sweeps—where volume reveals accumulation, distribution, and traps before price makes them obvious often.
IV. Smart Money (Wyckoff + Liquidity, without the hype)
“Smart money” is a shortcut phrase. In this guide it simply means: large participants interact with liquidity, and their footprints often appear as volume + structure behavior. You don’t “detect whales.” You measure acceptance, rejection, and absorption.
A) Wyckoff phases (how volume maps the story)
Wyckoff is useful because it forces a sequence. You’re not chasing single candles; you’re reading a campaign—one that typically unfolds in recognizable stages.
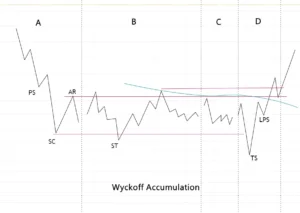
Phase A: Stopping the downtrend (selling climax).
A fast drop often ends with a volume spike, but the key is what happens next: follow-through weakens. Long lower wicks and an initial “automatic rally” are common signs that aggressive selling is being absorbed.
Phase B: Building the range (the “cause”).
Instead of trending, price rotates while volume spreads across the range. As this happens, Volume Profile usually thickens around a developing POC, showing where the market is most comfortable transacting.
Phase C: The test / spring (liquidity trigger).
Here’s the trap: price briefly pushes below support to run stops, then snaps back. What matters isn’t the wick—it’s participation. If sellers can’t extend lower even after the sweep, that failure carries more information than the spike itself.
Phase D/E: Markup and continuation.
When the market starts accepting higher prices, it will often hold above value (staying above VAH) and build new value higher. That acceptance—not a single breakout candle—is what typically supports continuation.
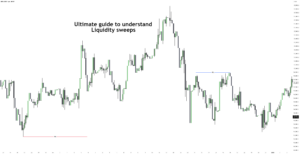
B) Liquidity zones (why fakeouts happen)
Liquidity is where orders cluster: previous highs/lows, obvious trendlines, and “round numbers.” In crypto, stop clusters are common near:
-
PMH/PML (previous month high/low)
-
Prior day high/low (intraday)
-
Range edges (value boundaries)
A classic pattern is the liquidity sweep: price pokes through a level, triggers stops, grabs liquidity, then reverses into value. Example framing: “BTC sweeps $28.5k, fails to accept below, and reclaims the range.” The sweep itself isn’t bullish—the reclaim and acceptance are.
V. Practical application (confluence that actually works)
Confluence is not “more indicators.” It’s non-redundant evidence.
Wrong confluence (redundant):
-
RSI + Stochastic + another oscillator
All measure similar momentum signals. You feel confident, but you’re just triple-counting one input.
Right confluence (complementary):
-
Trend filter: MA structure (e.g., higher highs/lows + a moving average)
-
Momentum check: RSI (is momentum supportive?)
-
Participation: OBV / A/D (is volume aligned?)
-
Risk ruler: ATR (how wide should invalidation be?)
Volume can confirm participation, but it does not define how much risk is acceptable. That depends on volatility.
This is why volume-based confluence works best when paired with volatility-based risk calibration—ATR and Bollinger Bands help size invalidation realistically, preventing tight stops in unstable conditions or oversized exposure in calm regimes.
Multi-timeframe hierarchy (simple and effective)
-
Higher timeframe defines regime (trend vs range).
-
Mid timeframe defines key levels (range edges, VAH/VAL, POC).
-
Lower timeframe refines entries (reclaim, retest, rejection wicks).
Confluence matrix
| Goal | Trend (MA/structure) | Momentum (RSI) | Participation (OBV/A/D) | Value (Profile/VWAP) | Risk (ATR) |
|---|---|---|---|---|---|
| Trend continuation | Aligned | Supportive | Rising / confirming | Pullback holds value | Stop sized to regime |
| Range rotation | Flat / boxed | Mean-reverting | Mixed | Fade VAH/VAL | Tight relative to range |
| Breakout attempt | Compression → release | Expanding | Breaks with price | Accepts outside value | Stop beyond failed acceptance |
Three real-use examples (templates)
-
Breakout filter: Price breaks range high, but OBV stays flat and Profile shows no acceptance above VAH → treat as “attempt,” wait for retest + acceptance.
-
Range trade: Price rejects VAH, VWAP rolls over, A/D weakens → rotate back toward POC is more likely than chasing highs.
-
Trend pullback: Uptrend intact, price dips to VWAP/HVN, OBV holds higher low, ATR says wider stop needed → add exposure only after reclaim.
VI. Mistakes (and when NOT to use volume)
-
Single-indicator dependence: volume tools confirm; they don’t predict.
-
Timeframe mismatch: don’t trade a 5-minute OBV divergence against a daily uptrend without a clear level.
-
Low-liquidity assets: volume is too noisy; indicators lie.
-
News shocks: volume spikes can be mechanical (liquidations), not informational.
-
Over-optimization: if your rules need ten conditions, they’ll fail live.
When not to lean on volume:
-
Thin microcaps
-
Post-news chaos (first minutes/hours)
-
Extremely low activity sessions
-
Markets with obvious data distortions
VII. 2025 context (why volume reading changed)
-
ETF and institutional participation: more benchmarked execution and liquidity concentration.
-
CEX/DEX fragmentation: “true volume” is spread; confirm across reliable venues when possible.
-
Bots and AI: more microstructure noise, more stop-hunting behavior around obvious levels.
-
Regulatory shifts: venue risk and reporting standards affect data quality.
-
24/7 markets: participation waves happen globally; volume regimes rotate faster than TradFi.
Because crypto trades continuously, participation and volume conditions can shift meaningfully from week to week.
To track these changes without reacting to short-term noise, we publish a Weekly News Review focused on market participation, liquidity shifts, and risk context.
VIII. Conclusion (keep it simple)
If you remember only five things, remember these:
-
Volume is context, not a directional signal.
-
OBV and A/D help you measure participation behind price.
-
Volume Profile and VWAP help you define value, acceptance, and rejection.
-
Timeframe discipline beats indicator stacking.
-
Risk first: define invalidation and size exposure before you chase upside.
| Quadrant | Price | Relative volume | Typical read | Next check |
|---|---|---|---|---|
| Q1 | Up | High | Supported move (or late FOMO) | Acceptance above VAH + OBV trend |
| Q2 | Up | Low | Fragile rally / squeeze risk | Liquidity above + weak participation? |
| Q3 | Down | High | Capitulation / forced selling | Does selling exhaust? Reclaim value? |
| Q4 | Down | Low | Drift lower / lack of bids | Watch VAL breaks + VWAP rejection |
FAQs for crypto volume analysis
Volume is a confirming indicator. It helps validate price behavior but does not predict future moves on its own.
Because volume spikes can be driven by liquidations or stop runs, not genuine demand or accumulation.
There is no single best indicator. OBV, A/D, and VWAP work best when combined with structure and context.
Liquidity reveals where orders cluster. Understanding liquidity zones helps explain fakeouts and reversals.
During low-liquidity sessions, post-news volatility, and in thin microcap assets where volume data is unreliable.